
Tutorial: Turn LinkedIn Analytics into an actionable plan with Gemini in Sheets

Over the past few months, Google has been integrating Gemini deeper into Workspace, including Docs, Gmail, and Sheets.
What started as a simple “Ask Gemini” side panel has evolved into an AI layer that can summarize datasets, generate fully editable charts, fix formulas, and even run analysis across multiple tables in one tab.
For most teams, Sheets is already where campaign reports, budgets, and performance trackers live. Now with Gemini in Sheets, you can describe what you want, such as “summarize this for me”, “show my top posts”, “turn this into a content plan,” and Gemini does the heavy lifting right inside the file.
This week, we’ll use that capability on something concrete: your LinkedIn Analytics. In five steps, we’ll turn a raw export into a living workspace that holds your overview, top-performing posts, key learnings, best-practice table, and next-month content plan.
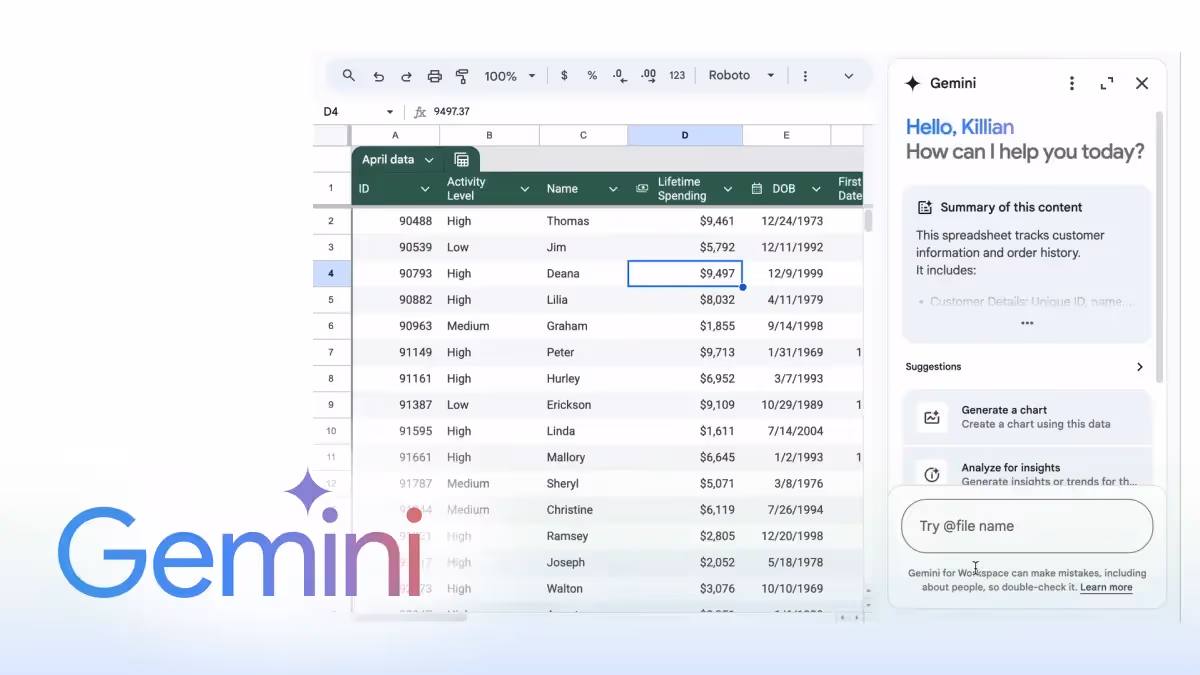
Step 1: Start with the bird’s-eye-view
Before you dig into individual posts or metrics, let Gemini give you the story of your data, including the patterns, outliers, big themes.
Action items:
- Open your LinkedIn Analytics file in Google Sheets.
- Click the Ask Gemini (spark icon) in the top-right side panel.
- Enter: “Can you give me an overview and summarisation of this table with some key insights?”
- After the summary appears, create a new tab and ask: “Turn this into a table and insert here.”
Step 2: Identify your top-performing posts
Now that you know the big picture, let’s zoom-in on what’s working: which posts delivered, and why they did.
Action items:
- Ask: “Create a table of the top 10 best-performing posts, considering likes and engagement rate.”
- Then ask: “Add a new column with key learnings from each post explaining why it performed better than others.”
Step 3: Dive deeper into the data
Once you’ve surfaced the big picture, dive deeper to uncover specific data points or create charts that help you understand and tell the story more clearly.
Action items:
- Visualize your findings: “Create a chart comparing how video content performs versus other content types in terms of likes and engagement rate.”
- Explore deeper with prompts like:
- “Compare average engagement rate across post formats - video, carousel, text, and article.”
- “List posts with high impressions but low engagement, and add a column suggesting improvement ideas.”
- “Group the posts by topic and show which themes perform best.”
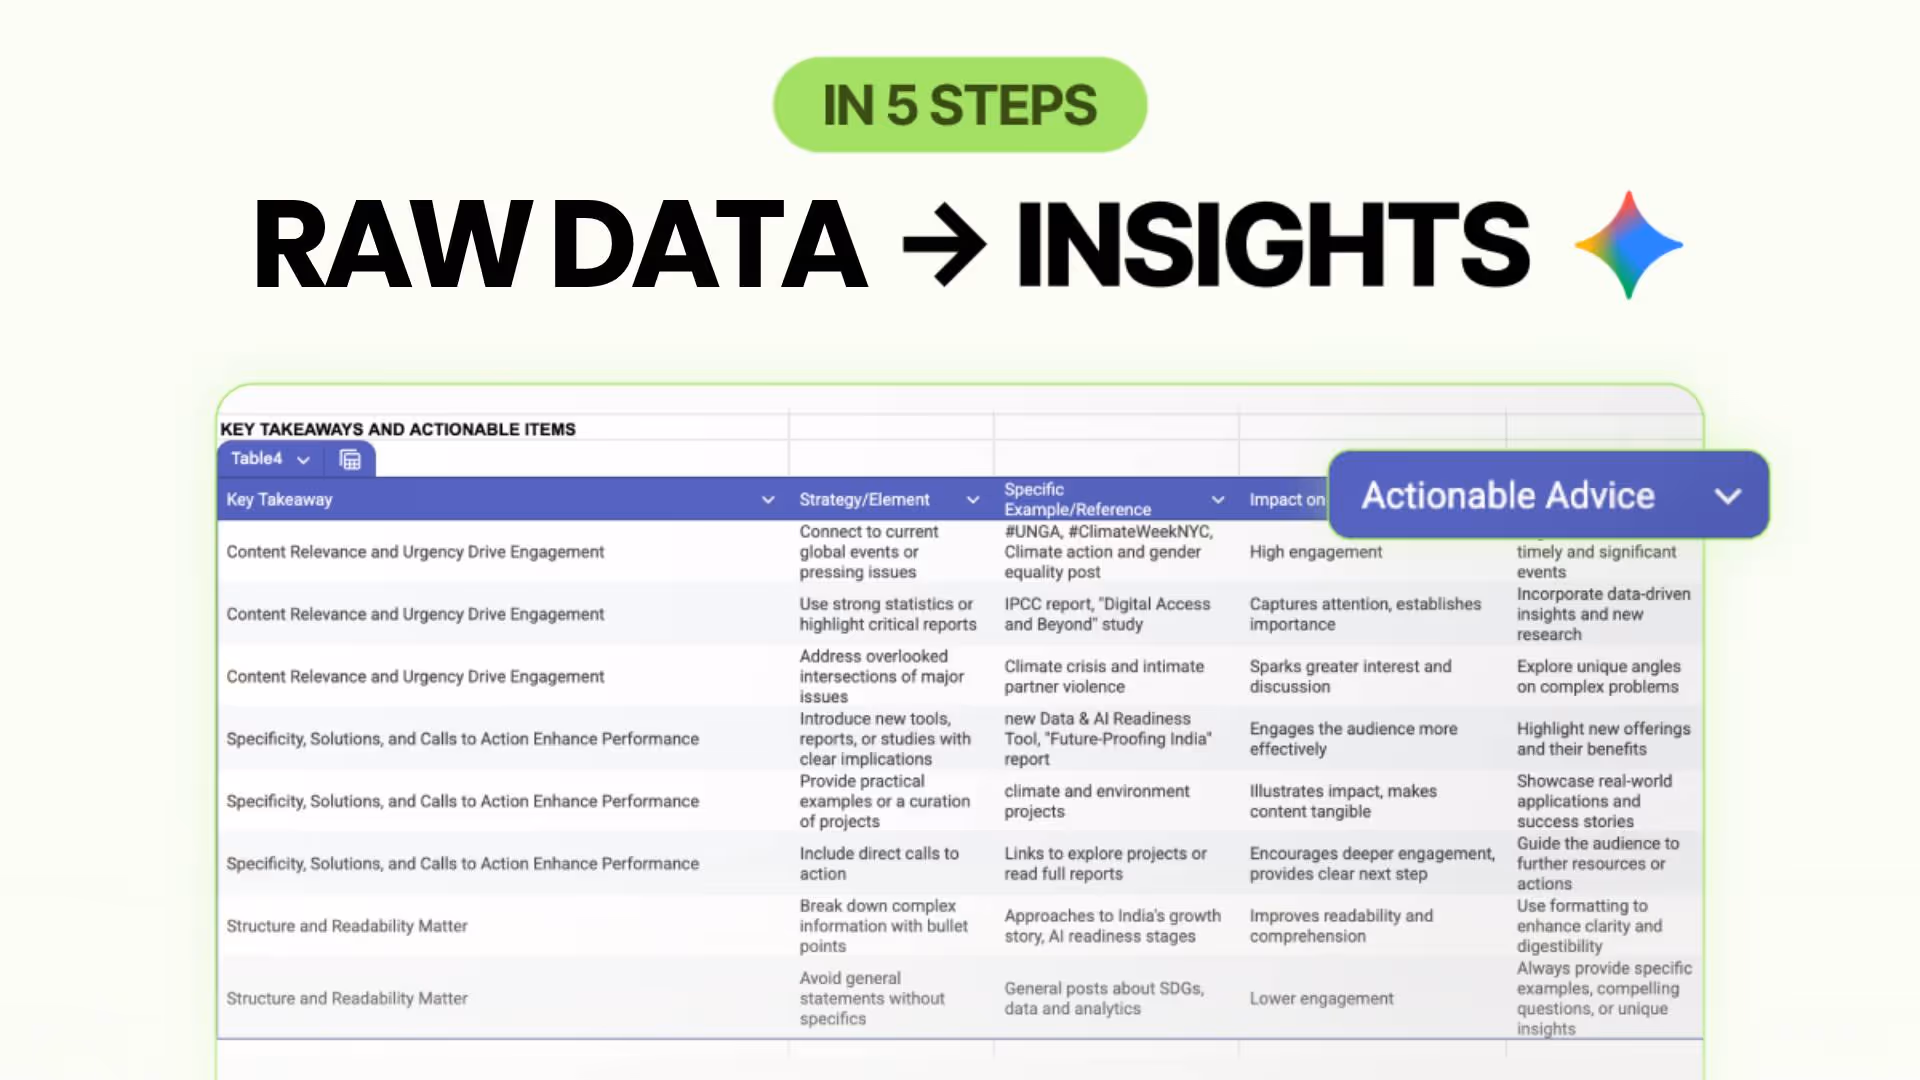
Step 4: Translate performance into lessons
Your analytics have stories; our job is to turn those stories into reusable plays. Gemini can help structure what works into a strategy framework.
Action items:
- Ask: “Turn these key takeaways into a table with columns: Strategy/Element, Example, Actionable Advice, Best Practice.”
- Ask Gemini to insert the resulting table into the same tab.
- Read through the table and mark which items you can scale or replicate next cycle.
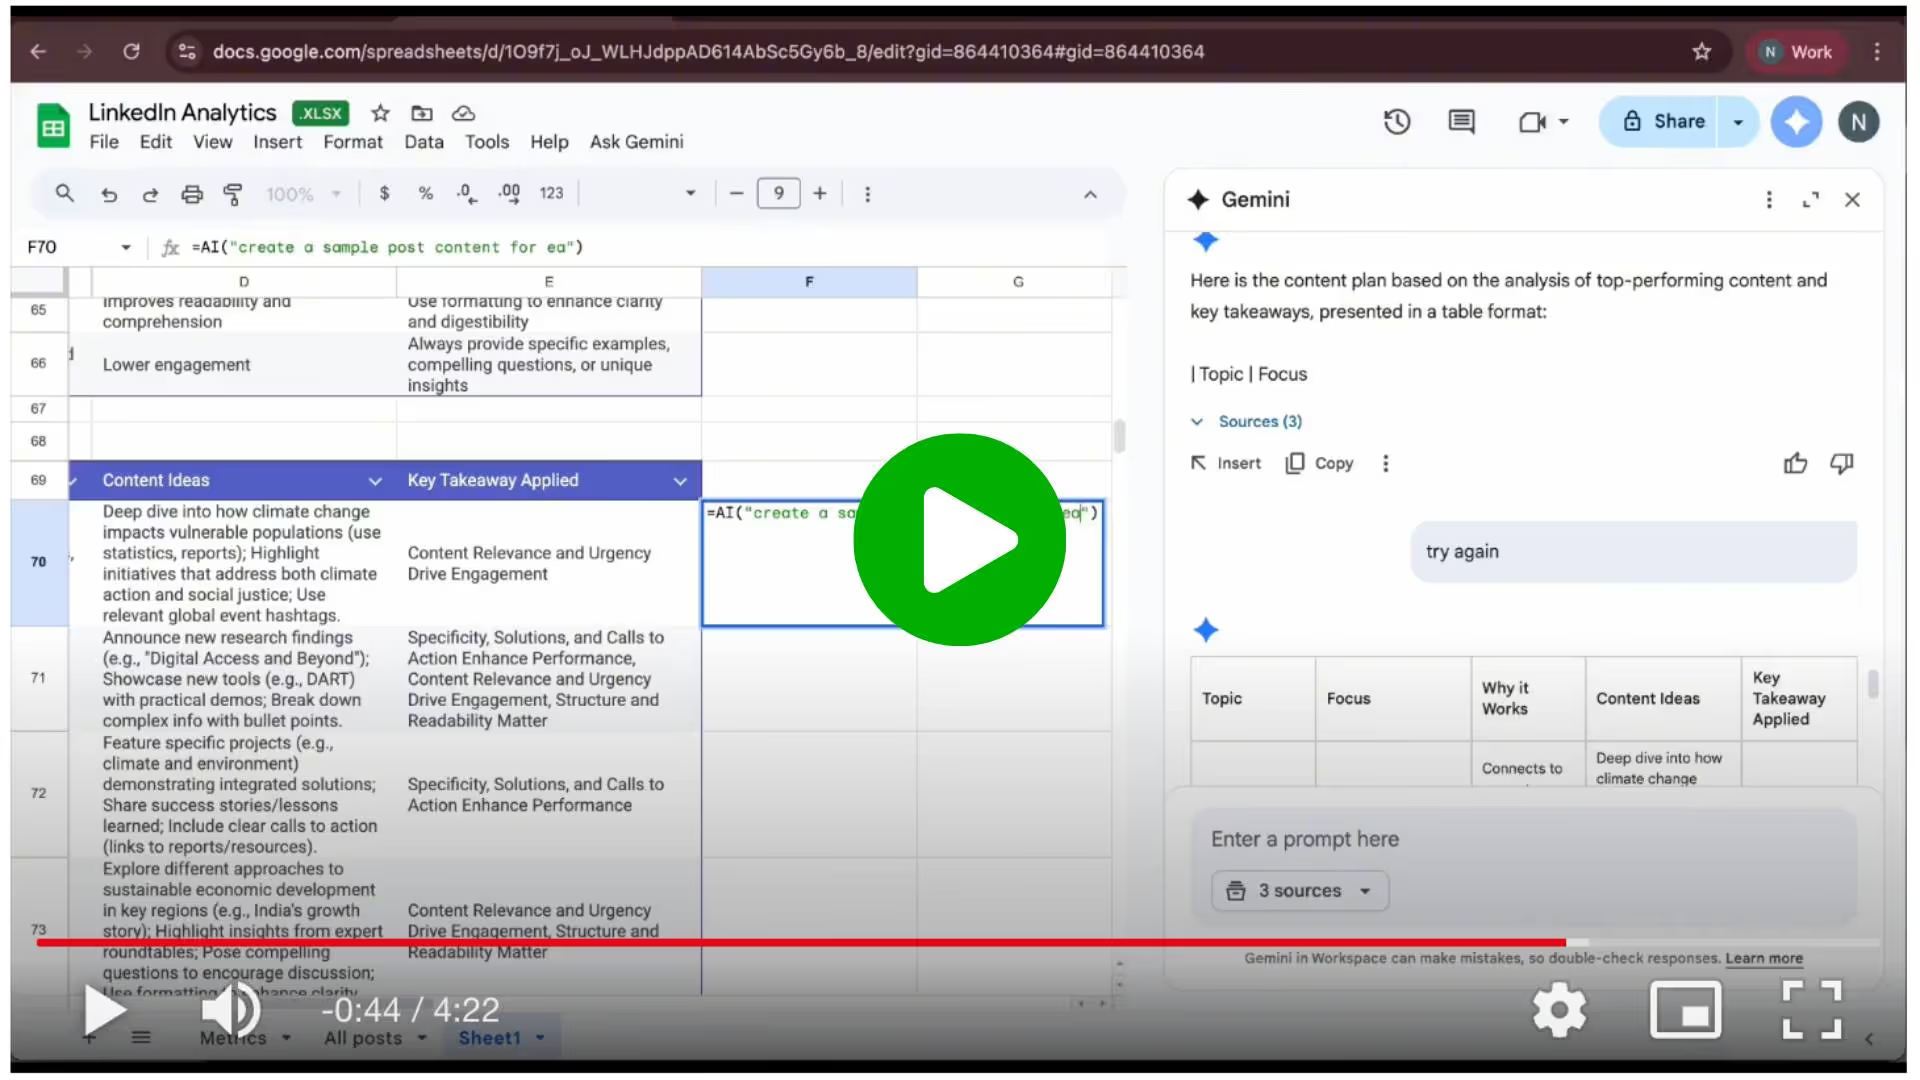
Step 5: Create next-month content plan with sample posts
The analytics, lessons and plan are ready. Now let’s generate the actual content ideas and even draft samples, all inside Sheets.
Action items:
- Ask: “Based on what you have analyzed and the top-performing posts, can you create a content plan with key topics we should include next month?”
- Add a new column titled Content Sample.
- At the menu bar, click Ask Gemini → Generate Text. This will create a new AI formula in the cell, allowing you to describe what you want to do in natural language. Prompt: “Create a sample LinkedIn post for each idea.”
- Review and refine each draft, then schedule or hand-off as needed.
With these five steps, you’ll end up with one live document in Sheets that contains an overview table of your analytics, a top-posts breakdown with learnings, a best-practices framework, and a content plan with sample posts.
PRO Members: watch the video tutorial here: In 5 Steps: Turn LinkedIn Analytics into an actionable plan with Gemini in Sheets