
Turn Your Files Into Impactful Data Tables

In December, Google rolled out Data Tables in NotebookLM, a small feature with a big impact if you work with research, reports, or long documents. Instead of rereading sources or manually pulling information into spreadsheets, NotebookLM can now structure what you’ve already imported into clear, comparable tables that you can customize and export.
In this guide, we’ll walk through a practical example: using Data Tables to make sense of AI applications in the workplace.
Step 1: Build a strong source base
You can upload your own materials and articles, or start by using NotebookLM Deep Research to explore the topic “AI applications in the workplace.”
It will gather relevant sources and produce an in-depth report. This helps you move beyond scattered articles and solidifies a reliable source base before structuring anything into a table.
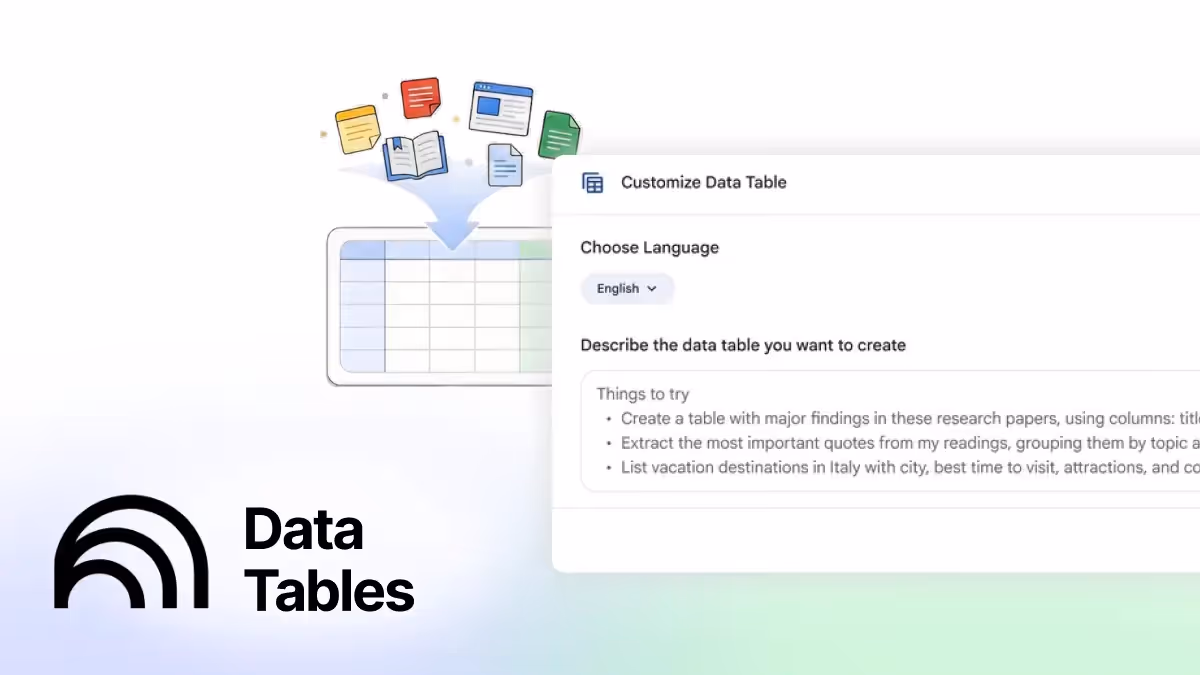
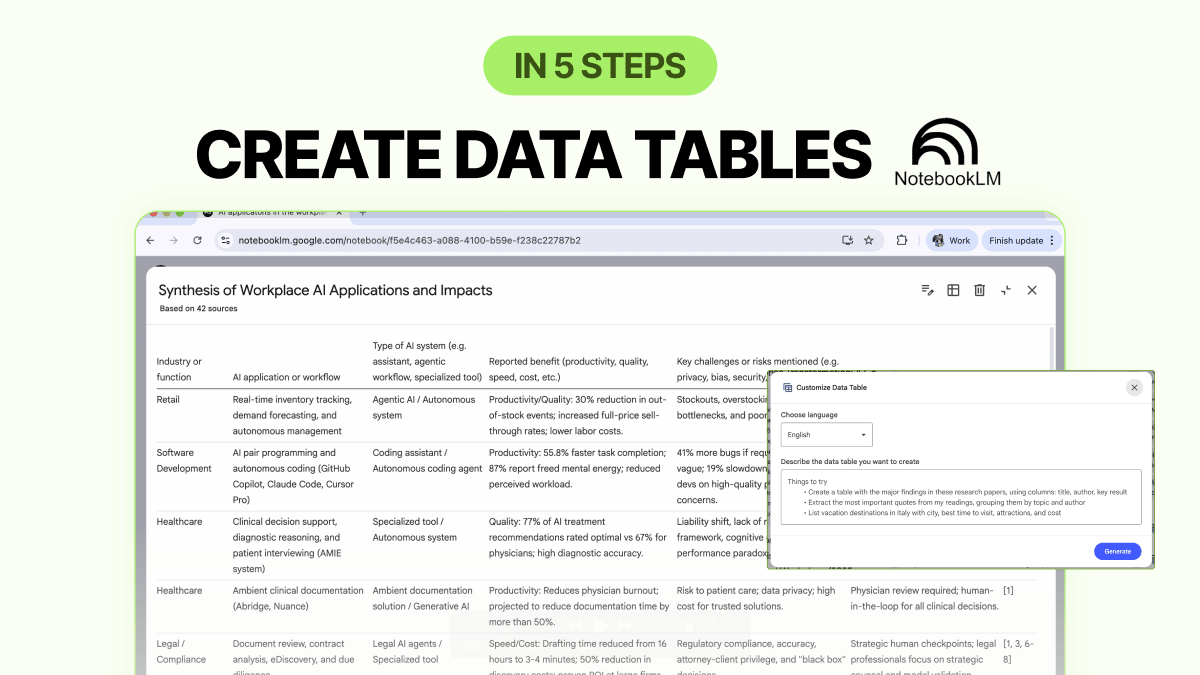
Step 2: Create a customized Data Table
Once your sources are imported, click the Data Table button and select the pen icon to customize the table.
Paste the following prompt:
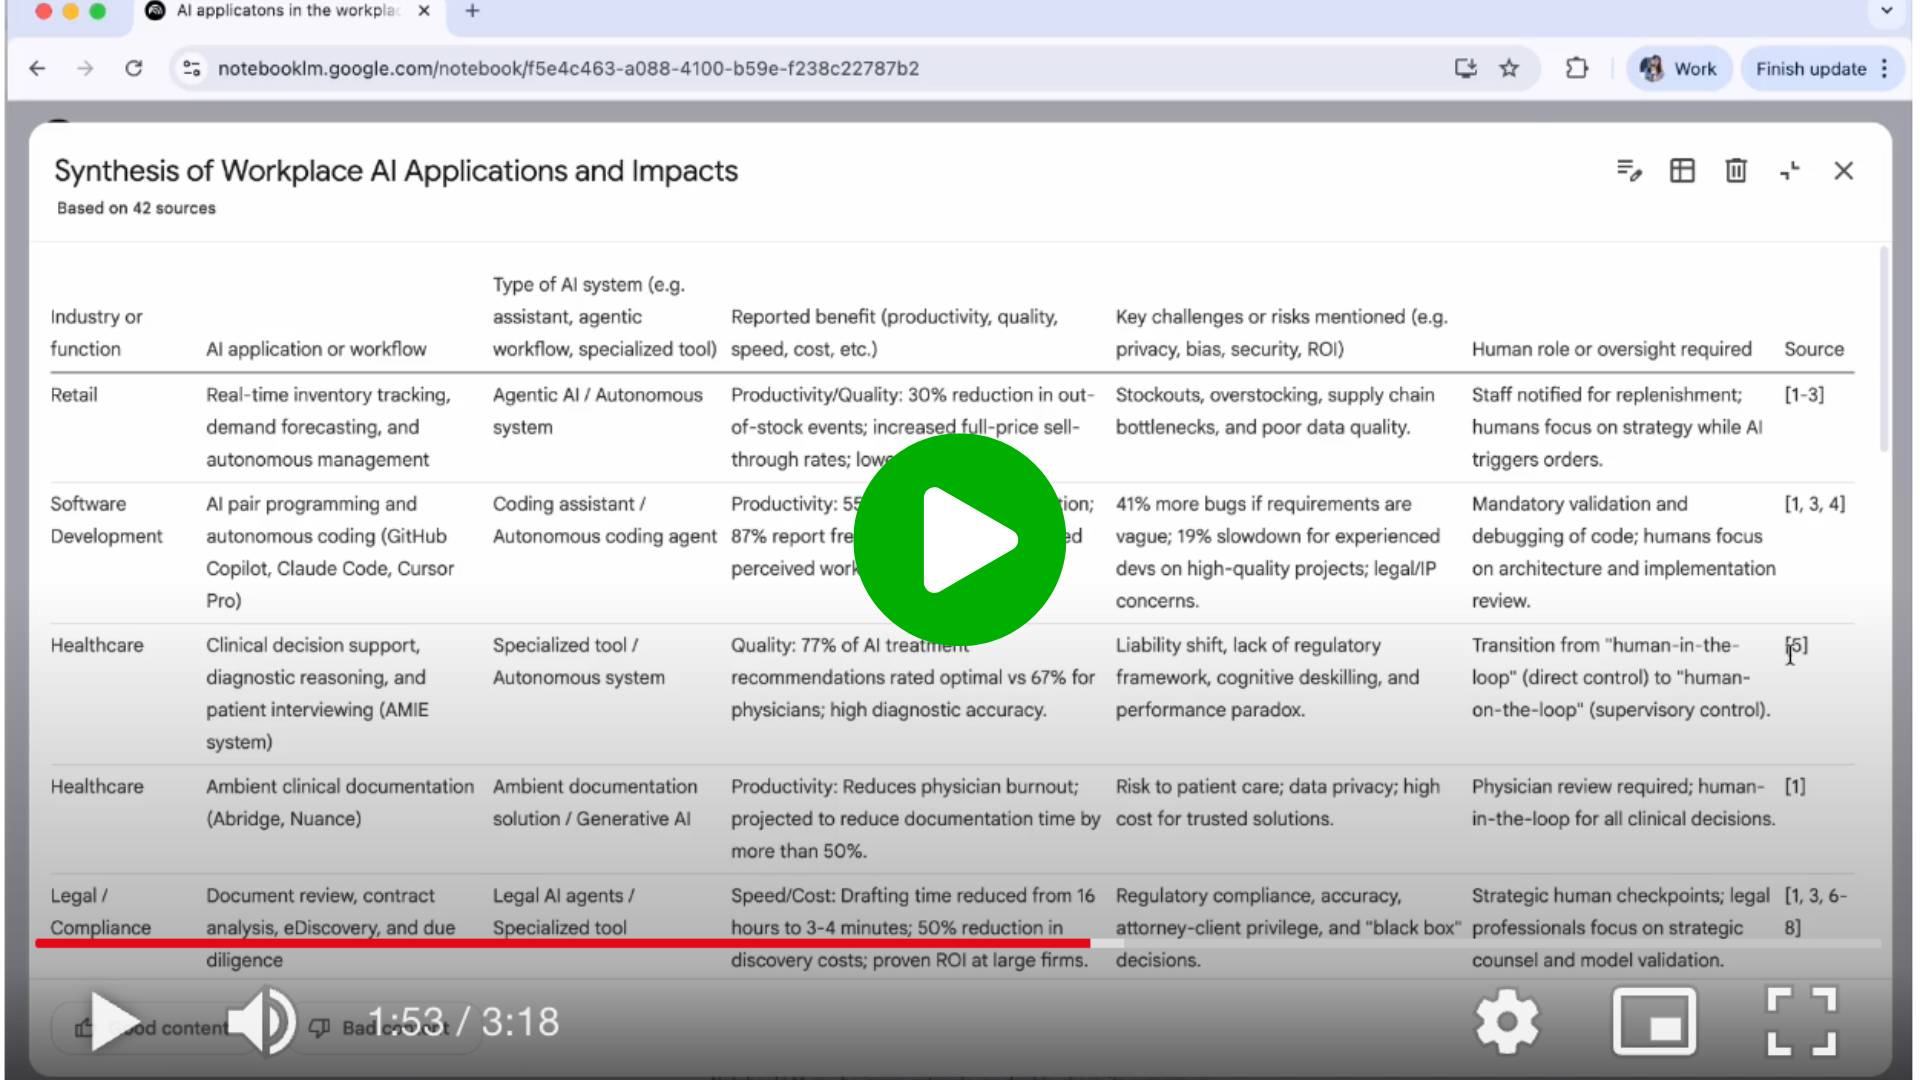
Create a data table that synthesizes AI applications in the workplace discussed across the imported sources.
Use the following columns:
- Industry or function
- AI application or workflow
- Type of AI system (e.g. assistant, agentic workflow, specialized tool)
- Reported benefit (productivity, quality, speed, cost, etc.)
- Key challenges or risks mentioned (e.g. privacy, bias, security, ROI)
- Human role or oversight required
- Source
NotebookLM will extract and organize information directly from your sources into a structured, comparable view.
Step 3: Iterate and create multiple tables
You can iterate the prompt and create as many tables as you need.
Based on the initial output, you can:
- Refine the columns
- Write a new prompt to create a new table that highlights a different aspect of the topic, such as a risk-focused view, an industry comparison of adoption patterns, or a human–AI collaboration perspective.
- Let NotebookLM generate tables without a custom prompt using the same sources, if you want a faster or more exploratory view
All tables still stay grounded in the same underlying documents.
Step 4: Export to Google Sheets for deeper analysis
When you’re happy with a table, export it to Google Sheets.
From there, you can:
- Continue refining the structure
- Ask Gemini in Sheets questions about the data to surface patterns or compare columns and categories
This is where synthesis turns into something you can actually work with and share.
Step 5: Integrate Data Tables into your workflow
Beyond this example, Data Tables are useful for:
- Comparing claims across reports, whitepapers, or internal documents
- Turning long-form research into a briefing-ready summary table
- Mapping risks, trade-offs, and safeguards mentioned across sources
- Preparing executive or board-level discussion materials grounded in evidence
PRO Members: watch the video tutorial here: In 5 Steps: Turn Your Files Into Impactful Data Tables