

A text answer about your data is useful. A chart you can explore is often more useful.
Claude analyzes uploaded datasets by writing and running code, then returns insights and interactive charts you can inspect. It can also turn the results into files, such as an Excel workbook or a web page you can download.
Where to find data analysis in Claude
In any chat, select + to upload your file, or bring it in from a connected source such as Google Drive.
Data analysis relies on Claude's ability to run code and create files. It is on by default for most accounts. If Claude cannot open your spreadsheet, check Settings, then Capabilities.
What your plan includes
- Every plan: code execution and file creation are available on Free, Pro, Max, Team and Enterprise plans, on the web, desktop and mobile.
- File size: each upload can be up to 30 MB.
- Team and Enterprise: owners can turn the feature off and decide whether Claude may reach the internet while it works.
- Connectors: sources such as Google Drive depend on your plan and admin settings.
When Claude data analysis earns its place
- You want to explore a chart, not just read a summary.
- You need a deliverable, such as a cleaned workbook, a chart file or a simple dashboard.
- Your data sits next to documents, such as a report and the numbers behind it.
- You want to compare groups visually, for example one segment against the total.
How to analyze data with Claude, step by step
The examples below use a public job market dataset with roles, salaries, skills and locations. The same prompts work on any dataset, from a sales export to survey results.
Step 1: Bring in your data. Upload the file or connect a source.
Step 2: Check how Claude reads it.
List every column and explain what each appears to represent. List five random samples of the data for each column.
Treat this as a trust step. Once the columns and values look right, move on.
Step 3: Drill into one question.
Which skills appear most frequently across high-paying positions? Count a position as high-paying when [its maximum salary is in the top 25 percent].
Step 4: Visualize the result. Ask for a chart, and Claude builds an interactive visual you can explore:
Create a chart showing the top skills associated with high-paying roles.
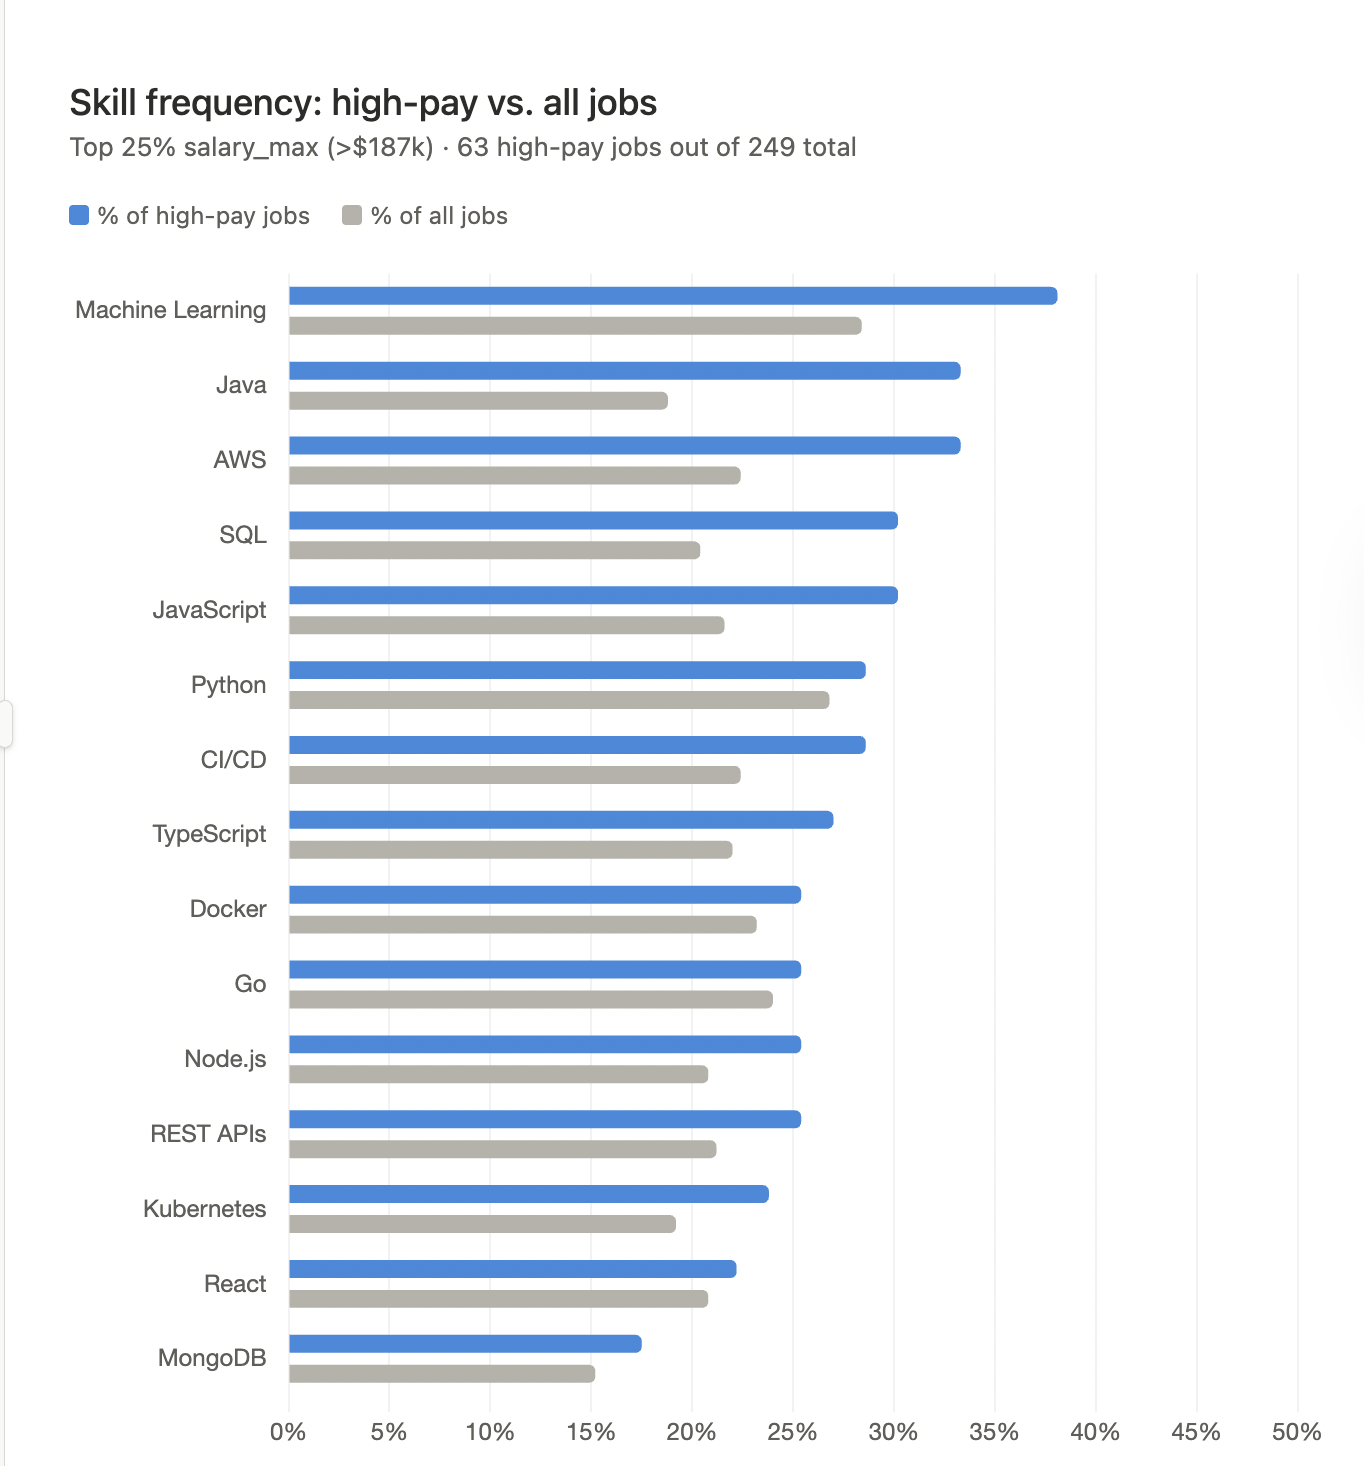
Step 5: Keep or download it. Keep the chart as an artifact in Claude, download it as an HTML file, or ask Claude to turn the results into an Excel workbook.
Step 6: Check the work. Ask Claude to explain how it calculated the key figures, and compare a few numbers with your file.
A useful habit: frame Claude's role around your lens, such as hiring, operations or strategy, because that shapes what it prioritizes. Treat the first charts as exploration, not a finished deliverable.
A CODO prompt to start with
Once you trust how the AI reads your data, use this prompt, built with our CODO framework, to turn the analysis into findings your audience needs. Replace the bracketed parts. Your own definitions matter most, because the AI otherwise picks its own.
Character: You are a senior data analyst who specializes in [sales data] and knows how to frame findings for [a leadership team].

Objective: I am the [Head of Sales] at [company] in [industry]. Analyze the [attached / open] dataset, surface the three most important patterns and flag anything concerning, so [my leadership team] can decide [where to focus next quarter].

Do:
- Before you analyze, list each column, what it appears to represent and any data quality issues you notice.
- Use my definitions: [a high-value customer has annual revenue above $50,000].
- Lead with the "so what", not the method.
- Show the calculation or the cells behind every number you report.
- Suggest one chart that would make the main finding clear.

Don't:
- Don't change or delete my original data. Put any new analysis in a separate sheet or file.
- Don't present estimates or assumptions as facts. Label them.

Output:
Three key findings of one paragraph each, followed by a 3 to 5 sentence summary for [my leadership team] that I can paste into an email or slide.
Want to build a reusable tool? Build a data visualization generator with Claude Artifacts shows how to create an app that turns any CSV into clean, filterable charts.
What will your IT and legal teams ask?
- Is our data used for training? Anthropic does not train its models on Team and Enterprise data by default.
- Where does the code run? In a sandboxed environment. Owners decide whether it may reach the internet, for example to install packages.
- Can we keep data inside the sandbox? Yes. With network access turned off, nothing can be sent out while Claude works.
- Who controls the feature? Team and Enterprise owners can turn code execution and file creation on or off.
Claude data analysis or another tool?
Claude is a strong choice when you want interactive charts or a file at the end, and it works on every plan.
To stay inside your workbook, use Claude for Excel. If ChatGPT is your main assistant, ChatGPT data analysis covers the same ground. On Google Workspace or Microsoft 365, Gemini in Google Sheets and Copilot in Excel work on your live file. Our overview of AI for data analysis compares all eight options.
Key takeaways
- Upload the file or connect a source.
- Check how Claude reads your data first.
- Ask for interactive charts to explore the results.
- Download what you need, from HTML charts to Excel files.
- Verify the key numbers before you share.