

Based on the Lead with AI AI Leader Advanced program.
Pivot tables, nested formulas and hours of filtering used to stand between you and the answer in your data.
AI tools can now read a spreadsheet, propose the right questions, run the analysis and build the chart. Think of AI as a very fast junior analyst. It is hardworking and always available, but it still needs your supervision.
What can AI do with your data?
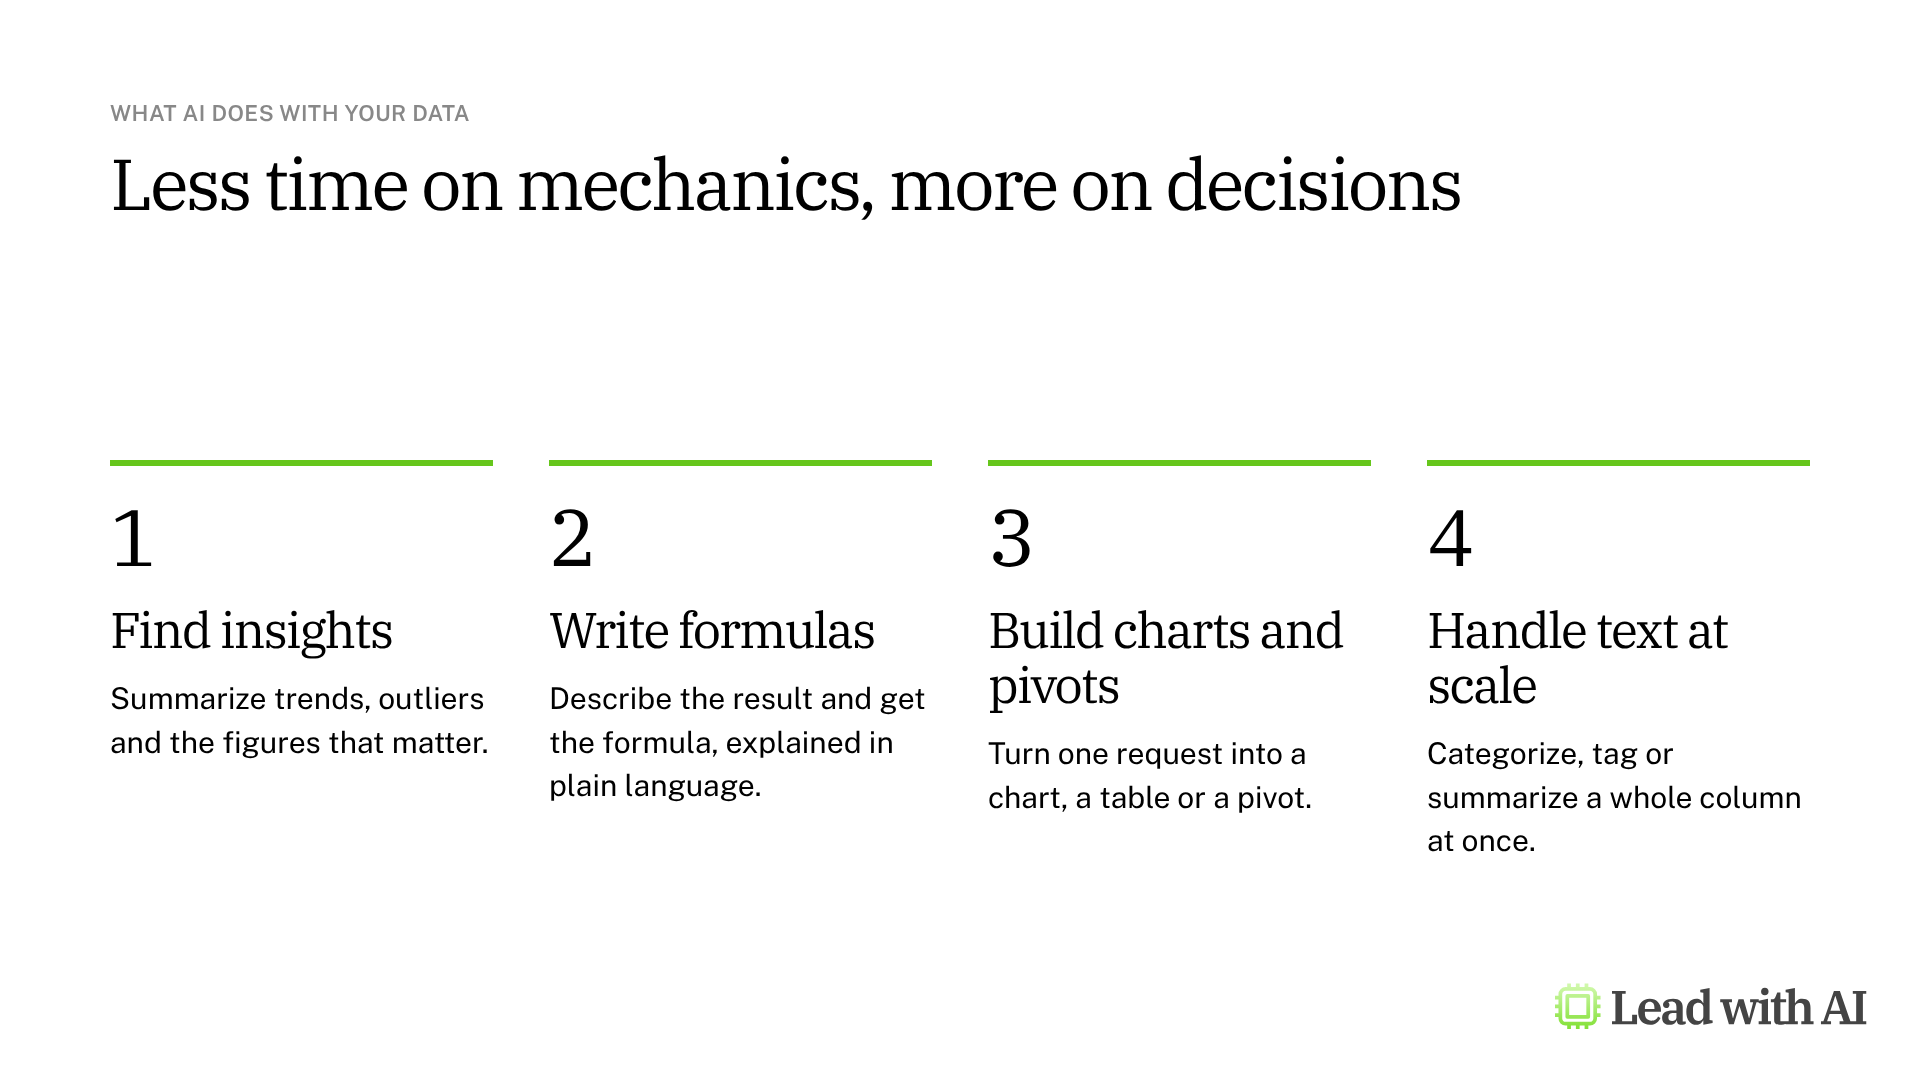
- Summarize data and find insights. Brief it like an analyst and get the trends, outliers and key figures.
- Generate and explain formulas. Describe the result you want, or ask what someone else's formula does.
- Suggest structures and create tables. Describe a tracker or comparison, and AI lays it out for you.
- Create charts and pivot tables. One request replaces the steps of selecting fields, grouping and formatting.
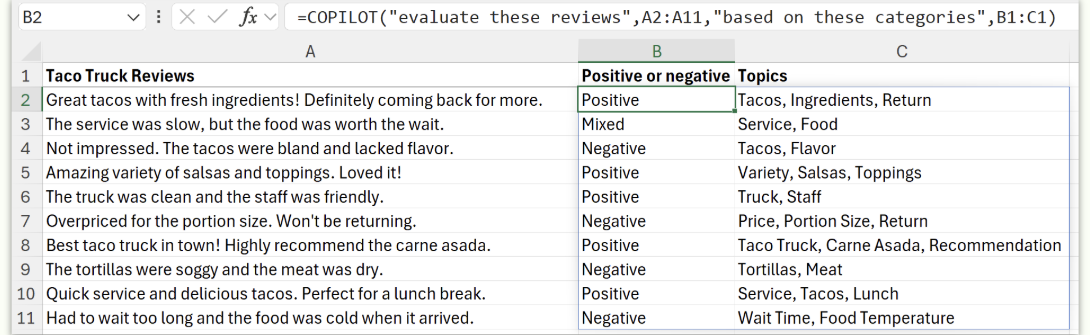
- Automate repetitive text work. In-cell AI functions, such as COPILOT in Excel and AI in Google Sheets, can tag or summarize a whole column.
Should you work inside the spreadsheet or in an AI chat?
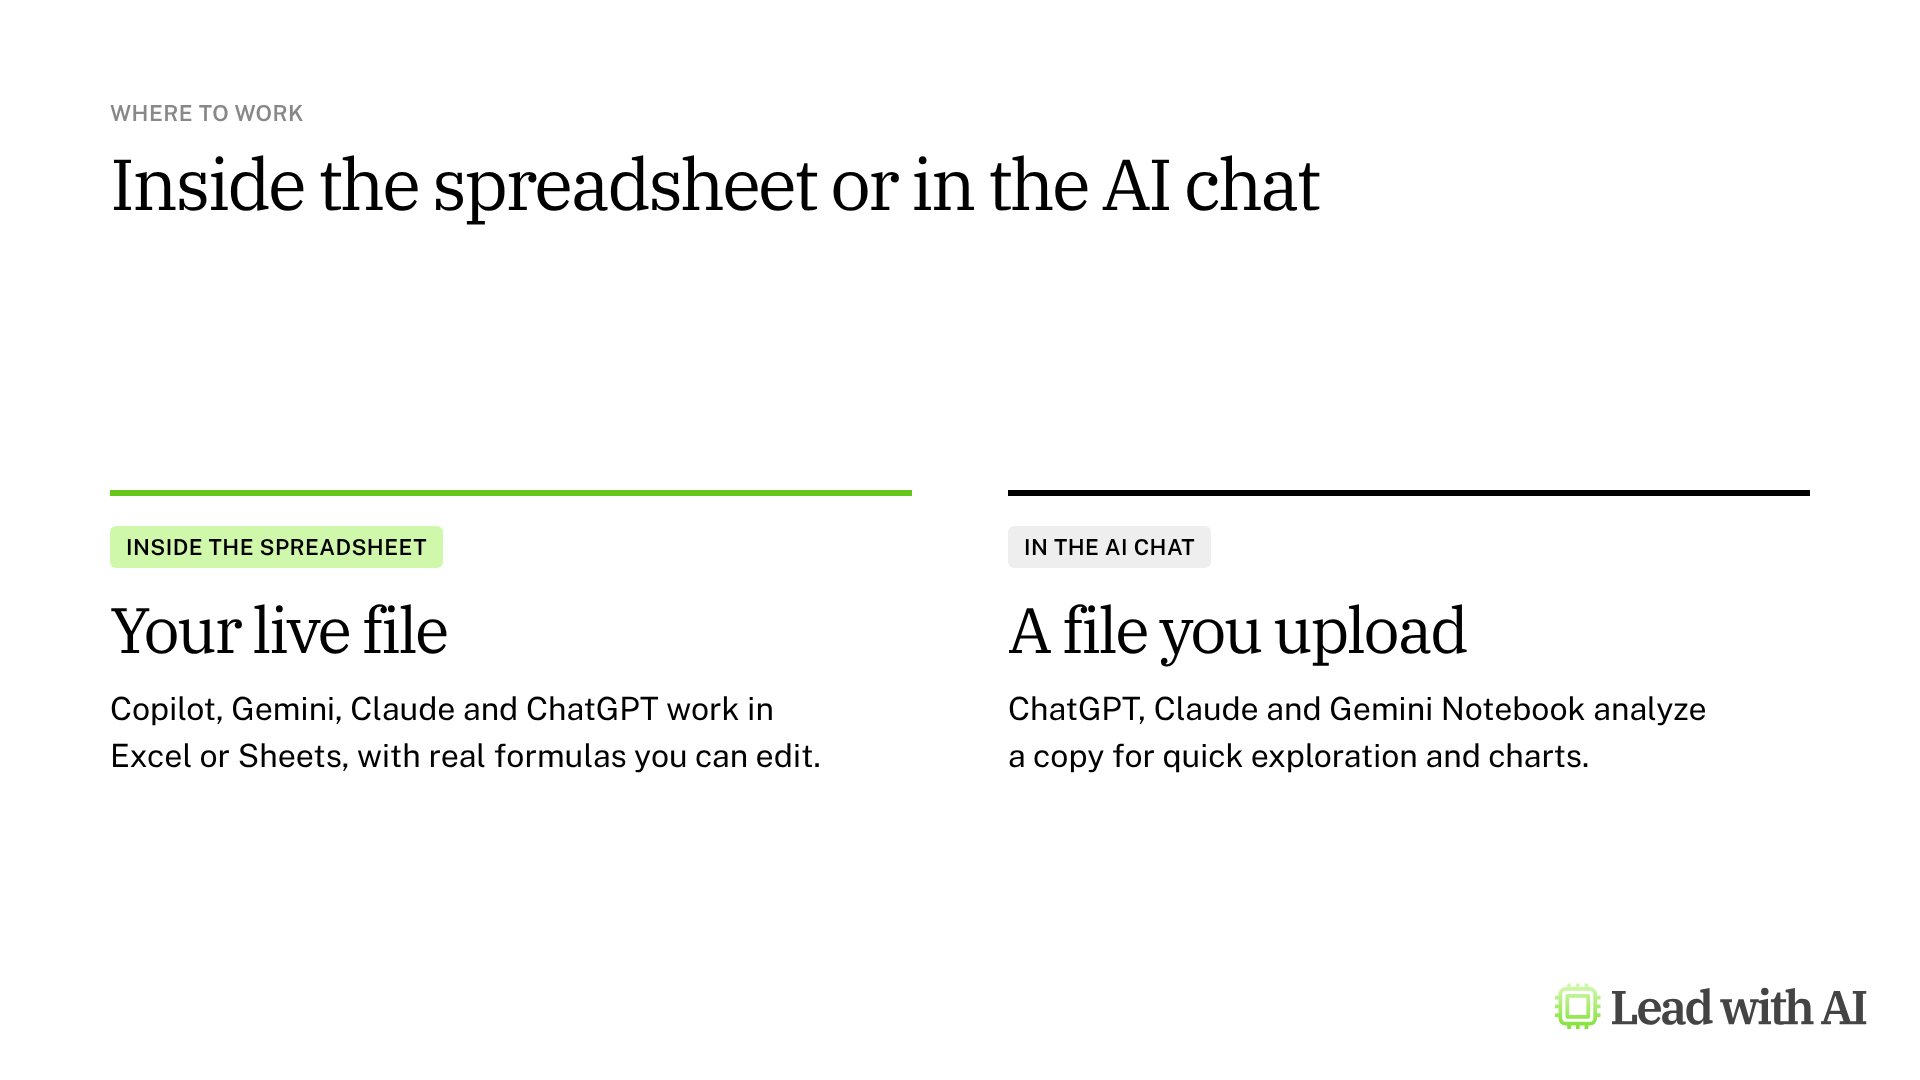
Inside the spreadsheet, AI works on your live file with real formulas and charts your team can keep using. In an AI chat, you upload a copy for quick exploration, interactive charts and downloadable files.
The eight data analysis tools at a glance
| Tool | Works in | Best for | Plans |
|---|---|---|---|
| Gemini in Google Sheets | Google Sheets | Google Workspace companies | Workspace Standard and Plus, Google AI Pro and Ultra |
| Copilot in Excel | Excel | Microsoft 365 companies | Microsoft 365 Copilot license, with standard access for smaller companies |
| Claude for Excel | Excel add-in | Financial models and traceable analysis | Pro, Max, Team and Enterprise |
| ChatGPT for Excel | Excel add-in | ChatGPT users who work in Excel | All plans |
| ChatGPT for Google Sheets | Google Sheets add-on | ChatGPT users who work in Sheets | All plans |
| ChatGPT data analysis | ChatGPT | Quick exploration of an uploaded file | All plans, with more on paid plans |
| Claude data analysis | Claude | Interactive charts and downloadable files | All plans |
| Gemini Notebook Data Tables | Gemini Notebook | Tables from data and research together | All plans |
Which data analysis tool should you use?
Start with where your data already lives. That is where your team works, and where your IT team has most likely settled the data questions.
- Google Workspace: Gemini in Google Sheets works on your live sheet with no add-on.
- Microsoft 365: Copilot in Excel works with native Excel features and workbook rules.
- ChatGPT as your main assistant: the add-ins for Excel and Google Sheets bring it into your files.
- Claude as your main assistant: Claude for Excel is built for deep work on models.
For work outside the spreadsheet, ChatGPT and Claude analyze uploaded files, and Gemini Notebook builds tables from data and research together.
The four-prompt workflow that works in every tool
Every guide in this series follows the same pattern, because it builds trust before it builds charts.
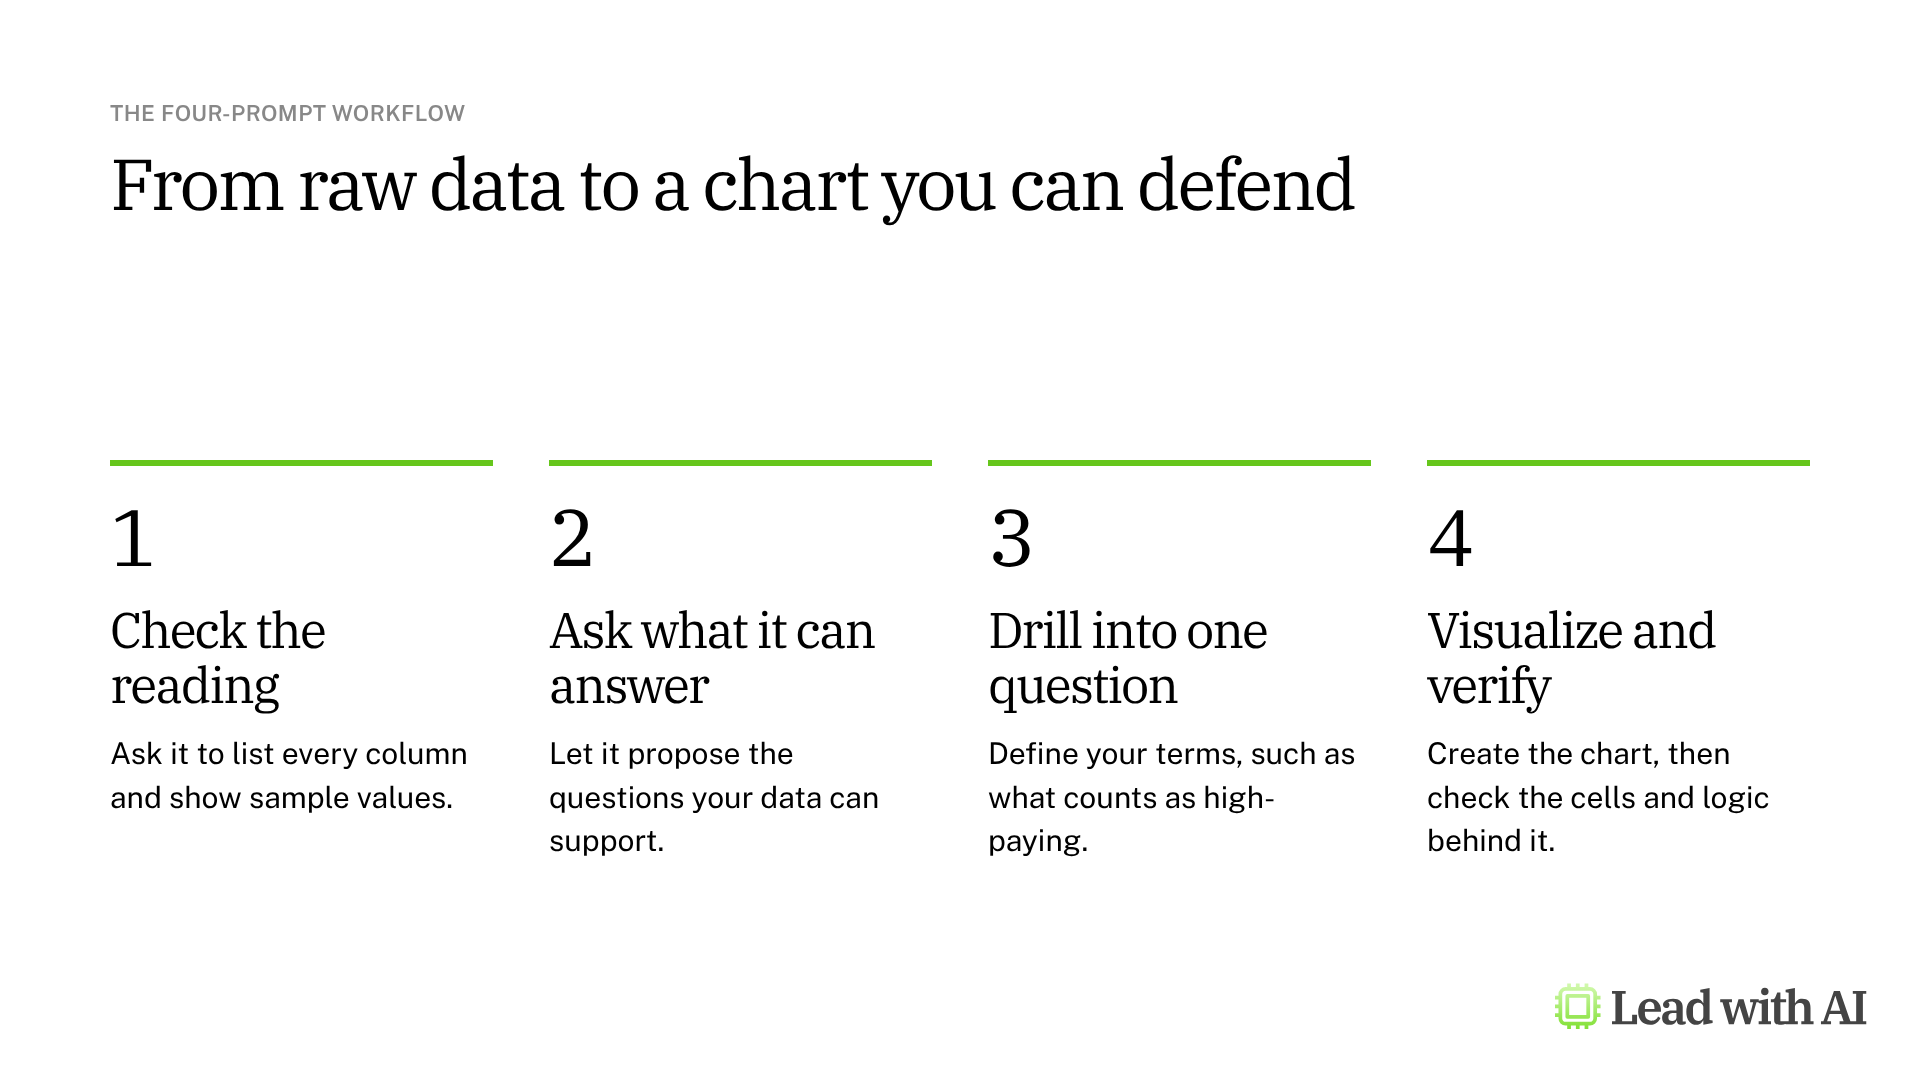
1. List every column and explain what each appears to represent. List five random samples of the data for each column.

2. What are the five most interesting questions this dataset is sufficient to answer?

3. Which skills appear most frequently across high-paying positions? Count a position as high-paying when [its maximum salary is in the top 25 percent].

4. Create a chart showing the top skills associated with high-paying roles.
The first prompt matters most. If the AI misreads a column, every answer after it inherits the mistake.
A CODO prompt for findings you can send
Once the analysis holds up, turn it into a story for your audience with our CODO framework. Replace the bracketed parts.
Character: You are a senior data analyst who specializes in [sales data] and knows how to frame findings for [a leadership team].

Objective: I am the [Head of Sales] at [company] in [industry]. Analyze the [attached / open] dataset, surface the three most important patterns and flag anything concerning, so [my leadership team] can decide [where to focus next quarter].

Do:
- Before you analyze, list each column, what it appears to represent and any data quality issues you notice.
- Use my definitions: [a high-value customer has annual revenue above $50,000].
- Lead with the "so what", not the method.
- Show the calculation or the cells behind every number you report.
- Suggest one chart that would make the main finding clear.

Don't:
- Don't change or delete my original data. Put any new analysis in a separate sheet or file.
- Don't present estimates or assumptions as facts. Label them.

Output:
Three key findings of one paragraph each, followed by a 3 to 5 sentence summary for [my leadership team] that I can paste into an email or slide.
What should you keep in mind?
- Always verify the outputs. AI can misread structure, logic or context, so check the numbers you will rely on.
- Clean data gives better answers. People can make sense of messy spreadsheets, but AI needs clear headers and a consistent structure.
- Complex workbooks can confuse the AI. Many cross-sheet links or deeply nested formulas raise the risk of errors.
- Very large files can fail. If a tool times out, split the file or focus it on one sheet.
- Only open trusted files. Hidden instructions in an outside spreadsheet can try to steer the AI.
Want a worked example? These how-to articles walk through real cases:
- Turn raw data into an actionable plan with Gemini in Sheets.
- Turn a spreadsheet into an interactive project dashboard with ChatGPT Sites.
- Build a data visualization generator with Claude Artifacts.
- Turn your files into impactful data tables.
Key takeaways
- Start with where your data lives, in Sheets, Excel or an AI chat.
- Check how the AI reads your data before you ask for insights.
- State your own definitions, so the analysis follows your logic.
- Keep the results traceable with cell links, source data or code.
- Stay accountable for the numbers you share.
This overview is based on the Data Analysis module in Lead with AI's AI Leader Advanced program. Lead with AI helps senior leaders build practical AI fluency through hands-on courses and a membership community.