

Research rarely comes in one format. You have reports, transcripts and notes, and somewhere a spreadsheet with the numbers.
Data Tables in Gemini Notebook reads your dataset next to your other sources and organizes it into a table you define in plain language. You can then export the table to Google Sheets, with the sources on a separate tab. Google renamed NotebookLM to Gemini Notebook in July 2026, and the feature works the same way.
Where to find Data Tables
Data Tables is one of the outputs in the Studio panel of a notebook, next to options such as Audio Overview and Reports. It works on any source, from a CSV dataset to meeting transcripts and PDFs.
What your plan includes
- Every plan: Data Tables is available on all plans, including free accounts, with no setting to turn on.
- Google Workspace: it is included in Business, Enterprise and Education editions where your admin has turned Gemini Notebook on.
- Web only: you build and export tables on the web, not in the mobile app.
When Data Tables earns its place
- Your data sits next to research, and you want one place to ask questions about both.
- Facts are scattered across documents, such as action items in meeting transcripts or results across several reports.
- You need a comparison table, such as competitors, vendors or options side by side.
- You want a starting point for Sheets that already carries its sources.
How to build a Data Table, step by step
The examples below use a public job market dataset with roles, salaries, skills and locations. The same prompts work on any dataset, from a sales export to survey results.
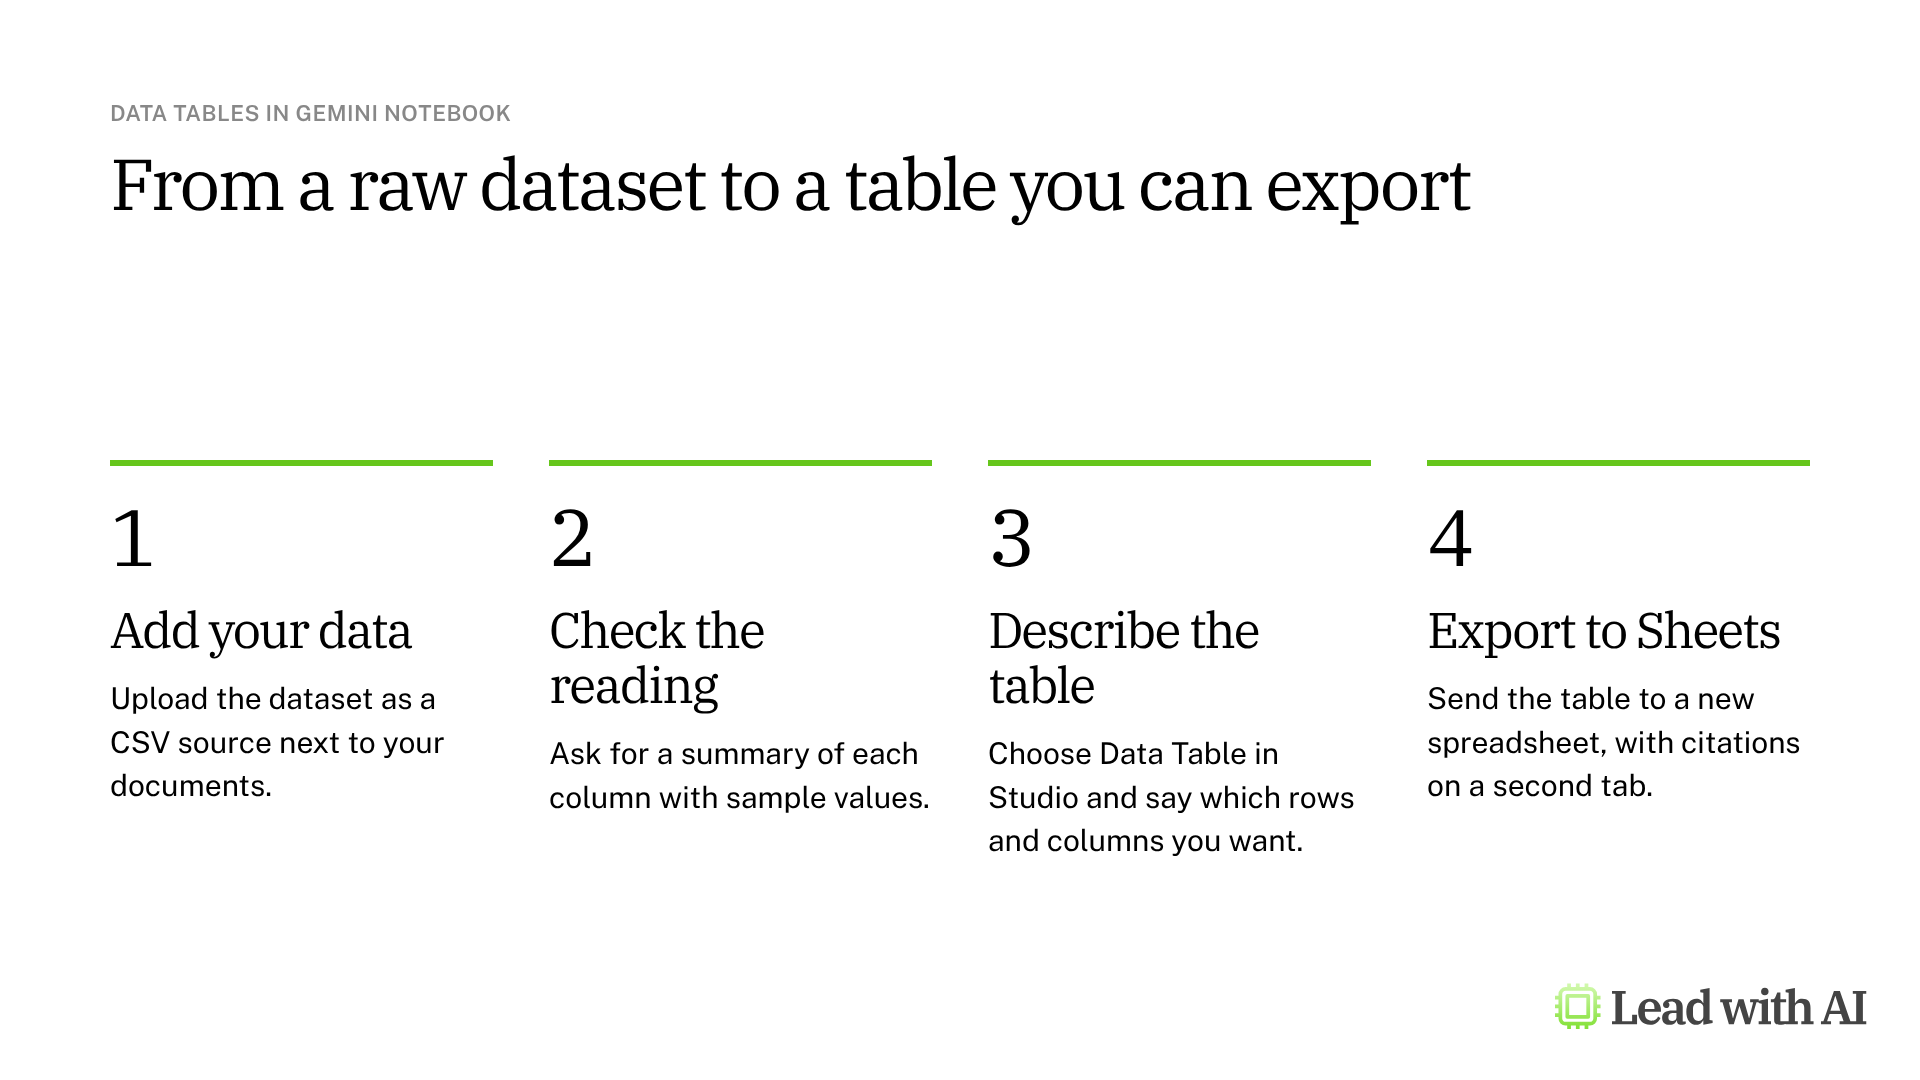
Step 1: Add your dataset as a source. Upload the file in CSV format, alongside any documents you want in the same notebook.
Step 2: Check the reading. Before you ask for a table, run one question in the chat:
Summarize what this dataset contains, and list what each column represents with a couple of sample values.
If a column is mislabeled or a value looks off, you catch it here, before it ends up in a table you act on.
Step 3: Describe the table you want. Open Studio, select Data Table and describe the rows and columns. One of Gemini Notebook's own suggested questions is often a good start:
Build a table of the highest-paying roles that offer fully remote work, including the compensation range and required experience for each.
Step 4: Ask follow-up questions. Use the chat to dig further, for example to compare salary ranges by city or list the common skills for a role.
Step 5: Export to Sheets. Open the three-dot menu on the table and select Export to Sheets. The table fills the first tab of a new spreadsheet, and the source citations go on a second tab.
Step 6: Keep analyzing in Sheets. From there, use Gemini or ChatGPT in Sheets to go deeper, and check a few rows against the original data.
A CODO prompt to start with
Once you trust how the AI reads your data, use this prompt, built with our CODO framework, to turn the analysis into findings your audience needs. Replace the bracketed parts. Your own definitions matter most, because the AI otherwise picks its own.
Character: You are a senior data analyst who specializes in [sales data] and knows how to frame findings for [a leadership team].

Objective: I am the [Head of Sales] at [company] in [industry]. Analyze the [attached / open] dataset, surface the three most important patterns and flag anything concerning, so [my leadership team] can decide [where to focus next quarter].

Do:
- Before you analyze, list each column, what it appears to represent and any data quality issues you notice.
- Use my definitions: [a high-value customer has annual revenue above $50,000].
- Lead with the "so what", not the method.
- Show the calculation or the cells behind every number you report.
- Suggest one chart that would make the main finding clear.

Don't:
- Don't change or delete my original data. Put any new analysis in a separate sheet or file.
- Don't present estimates or assumptions as facts. Label them.

Output:
Three key findings of one paragraph each, followed by a 3 to 5 sentence summary for [my leadership team] that I can paste into an email or slide.
Want more ideas? These pages show other ways to use Gemini Notebook:
- Turn your files into impactful data tables: a worked example of Data Tables on research sources.
- Gemini Notebook for research: build a brief from sources you approve.
- Gemini Notebook slide decks: turn your sources into a presentation.
What will your IT and legal teams ask?
- Is our data used for training? Google states that Workspace content is not used to train its generative AI models without permission.
- Who controls access? Workspace admins can turn Gemini Notebook on or off for users.
- Where do the sources live? In the notebook, under your account and its sharing settings.
- Can we trace the numbers? Yes. Exported tables include a separate tab with source citations.
Gemini Notebook or another tool?
Data Tables is the right choice when your data belongs with your research, or when you need structure from unstructured documents.
For analysis directly in a spreadsheet, use Gemini in Google Sheets or ChatGPT for Google Sheets. For quick exploration and charts, try ChatGPT data analysis or Claude. Our overview of AI for data analysis compares all eight options.
Key takeaways
- Upload your dataset as a CSV source next to your documents.
- Check the reading with one summary question.
- Describe the table you want in plain language.
- Export to Sheets to keep the sources with the data.
- Check a few rows against the original before you act.