

Based on the Lead with AI AI Leader Advanced program.
AI image generation in an executive course? Yes, because most leaders sit on valuable frameworks, processes and points of view that rarely become visual. Waiting on design is slow, so the tired slide layouts come back, and ideas do not travel as far as they should.
AI image generation removes that bottleneck. It works like an always-available visual assistant that turns your thinking into visuals you can reuse across decks, documents and updates.
How does it work?
Image models learn from vast numbers of images paired with text. Over time, they learn which visual patterns tend to appear with which words, and when you describe something, they predict which elements belong together. There is no understanding in the human sense, only a very strong statistical association.
That explains both the power and the limits. You can move from an abstract idea to a visual in seconds and explore several directions without a design tool. But a model will also produce something that looks right while subtly changing your meaning, default to generic interpretations and invent details when your instructions are vague.
Where is the value for leaders?
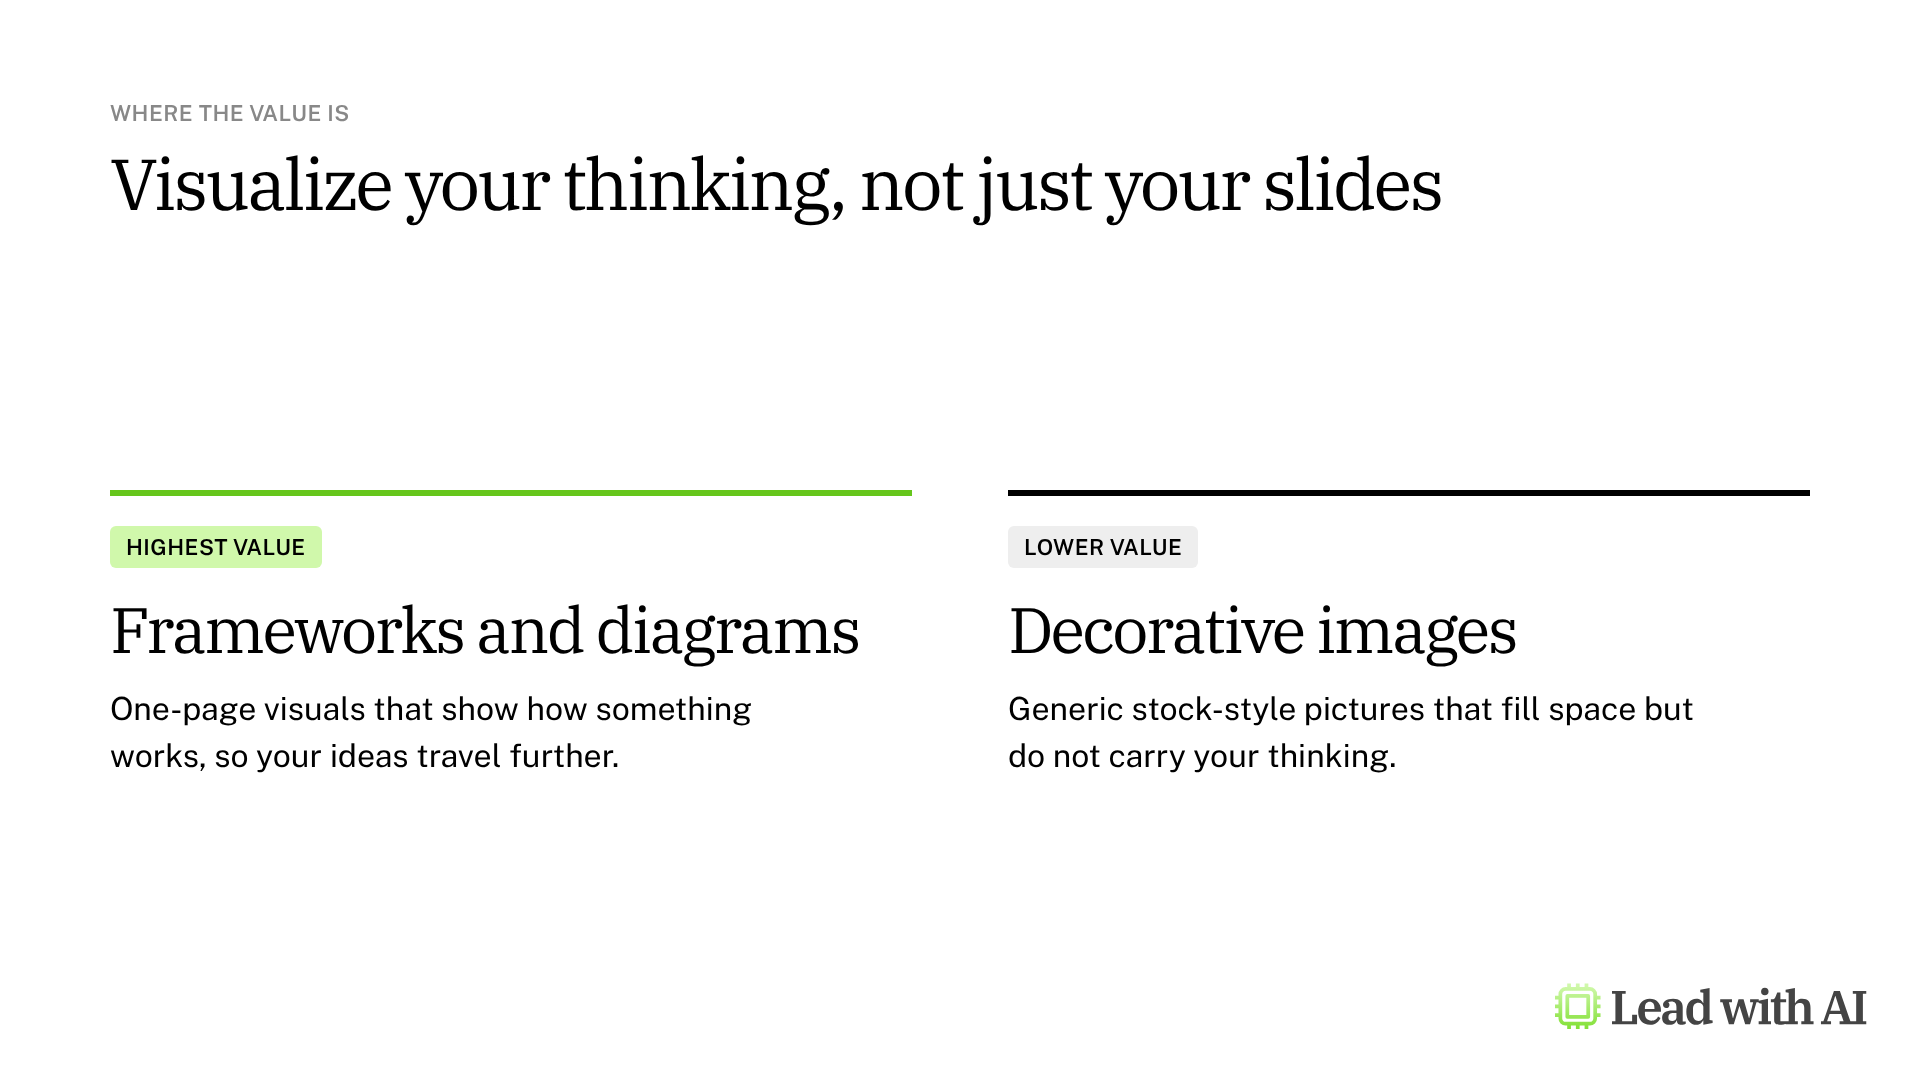
The highest-value outputs are rarely decorative images. They are diagrams, frameworks and one-page summaries that clarify how something works, and this is where image models have improved most.
There is a second benefit. When you turn your priorities into a visual, you quickly see whether they are distinct or quietly overlapping. The visual becomes a thinking tool, not a finishing step.
Where will you find image generation?
- Core AI platforms: ChatGPT, Gemini and Copilot, where image generation is part of the chat and driven by your prompt.
- Tools inside your apps: Copilot in PowerPoint, Gemini in Google Slides, Canva and Gamma generate visuals where you already work.
- Dedicated image tools: specialist tools such as Midjourney and Ideogram, for design-led work.
How to brief AI for a visual
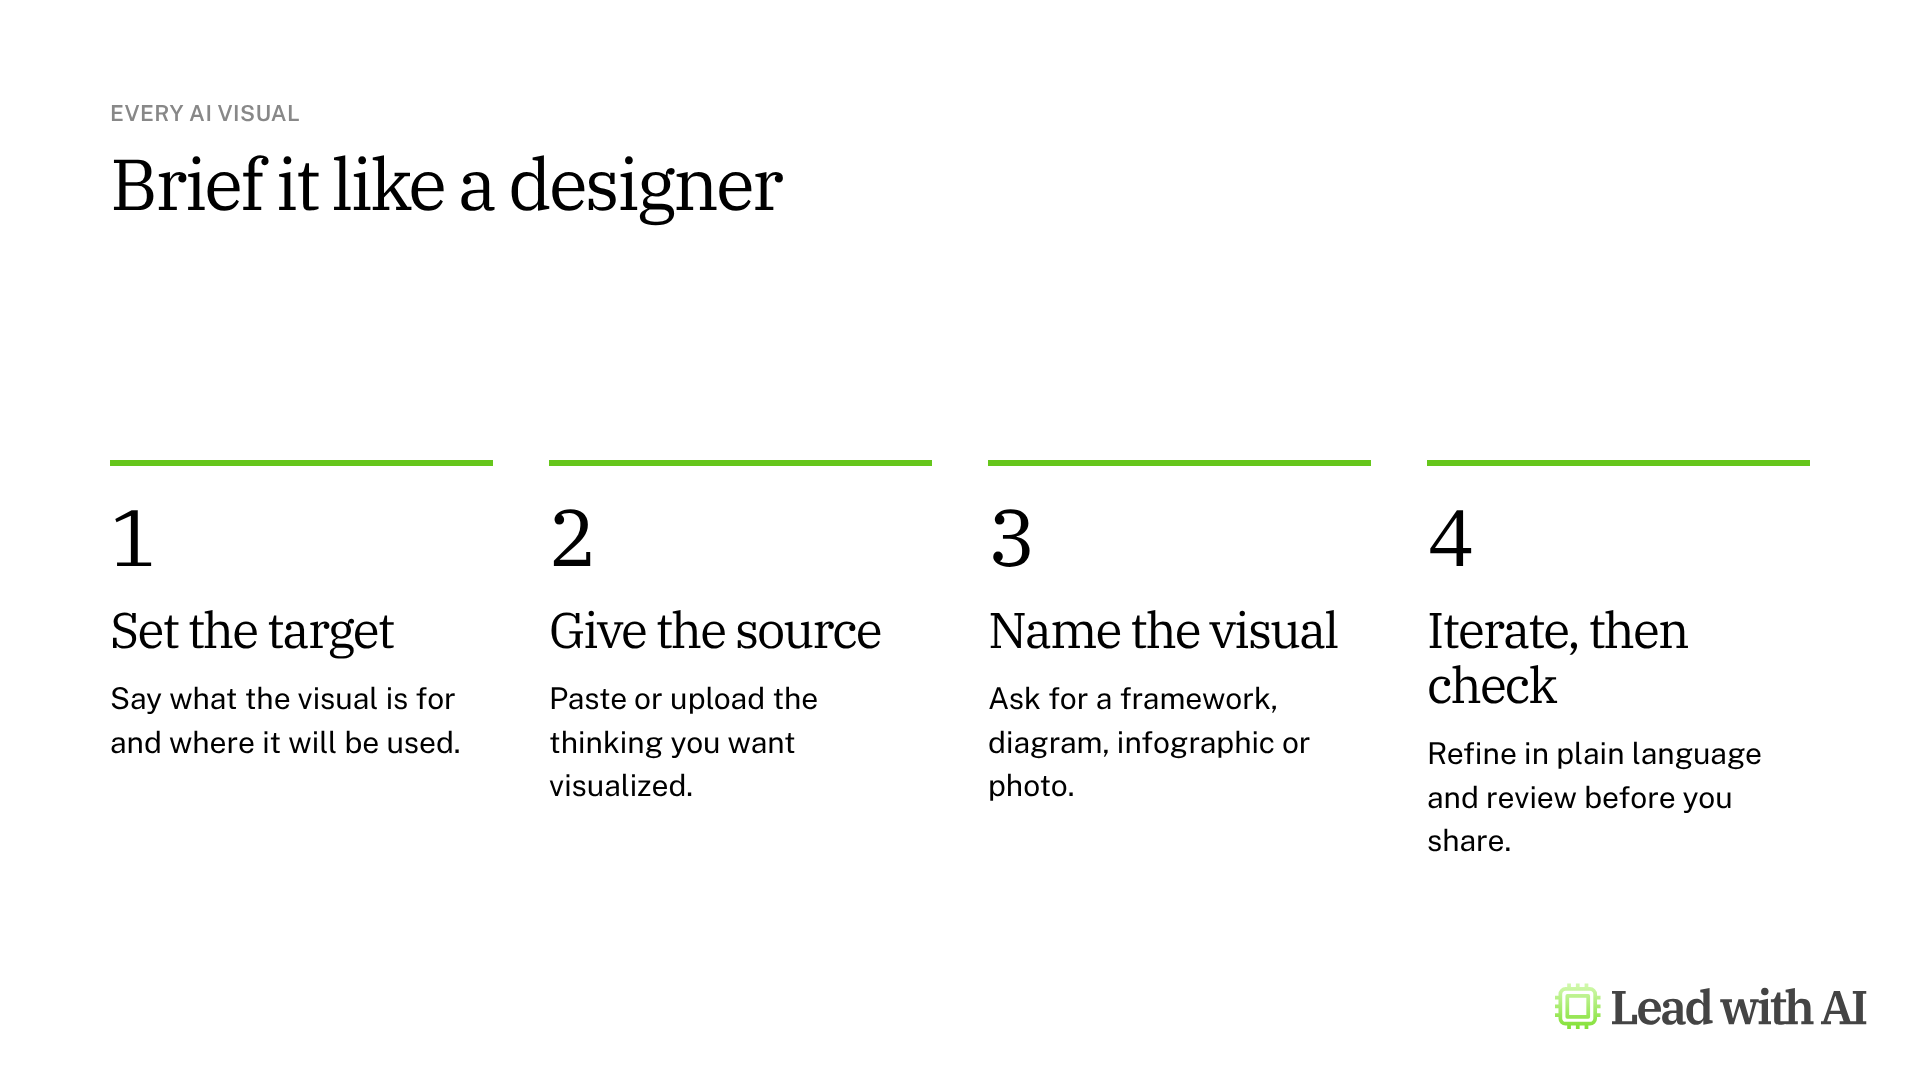
- Set the target: what is this visual for, and where will it be used?
- Give the source: paste or upload the thinking you want visualized.
- Name the visual: a diagram, framework, infographic, illustration or stock-style photo.
- Iterate, then check: simplify and restructure in plain language. Many tools now edit one part while the rest stays the same.
Finish with accountability. Check that the visual matches your meaning before you reuse it.
The four tools at a glance
| Tool | Where | Best for | Plans |
|---|---|---|---|
| ChatGPT Images | Any ChatGPT chat, or Images in the sidebar | Framework visuals and infographics you refine over several rounds | Every plan, with tighter limits on Free |
| Nano Banana | The Gemini app, plus Docs, Slides and Vids | Editing images and keeping a consistent look in Google Workspace | Every Gemini user, with Pro redos on paid plans |
| Gemini Notebook | The Studio panel in a notebook | Infographics built only from your own documents | Free Google Accounts, with higher limits on paid plans |
| Copilot Create | Create in the Microsoft 365 Copilot app | On-brand posters, banners and visuals with hands-on editing | Work accounts with or without a Copilot license, and Microsoft 365 personal plans |
Which tool should you use?
- For a framework you will refine over several rounds: ChatGPT Images.
- If your company runs on Google Workspace: Nano Banana in Gemini.
- When the visual must stay true to your documents: Gemini Notebook infographics.
- If your company runs on Microsoft 365: Copilot Create.
The four-point check
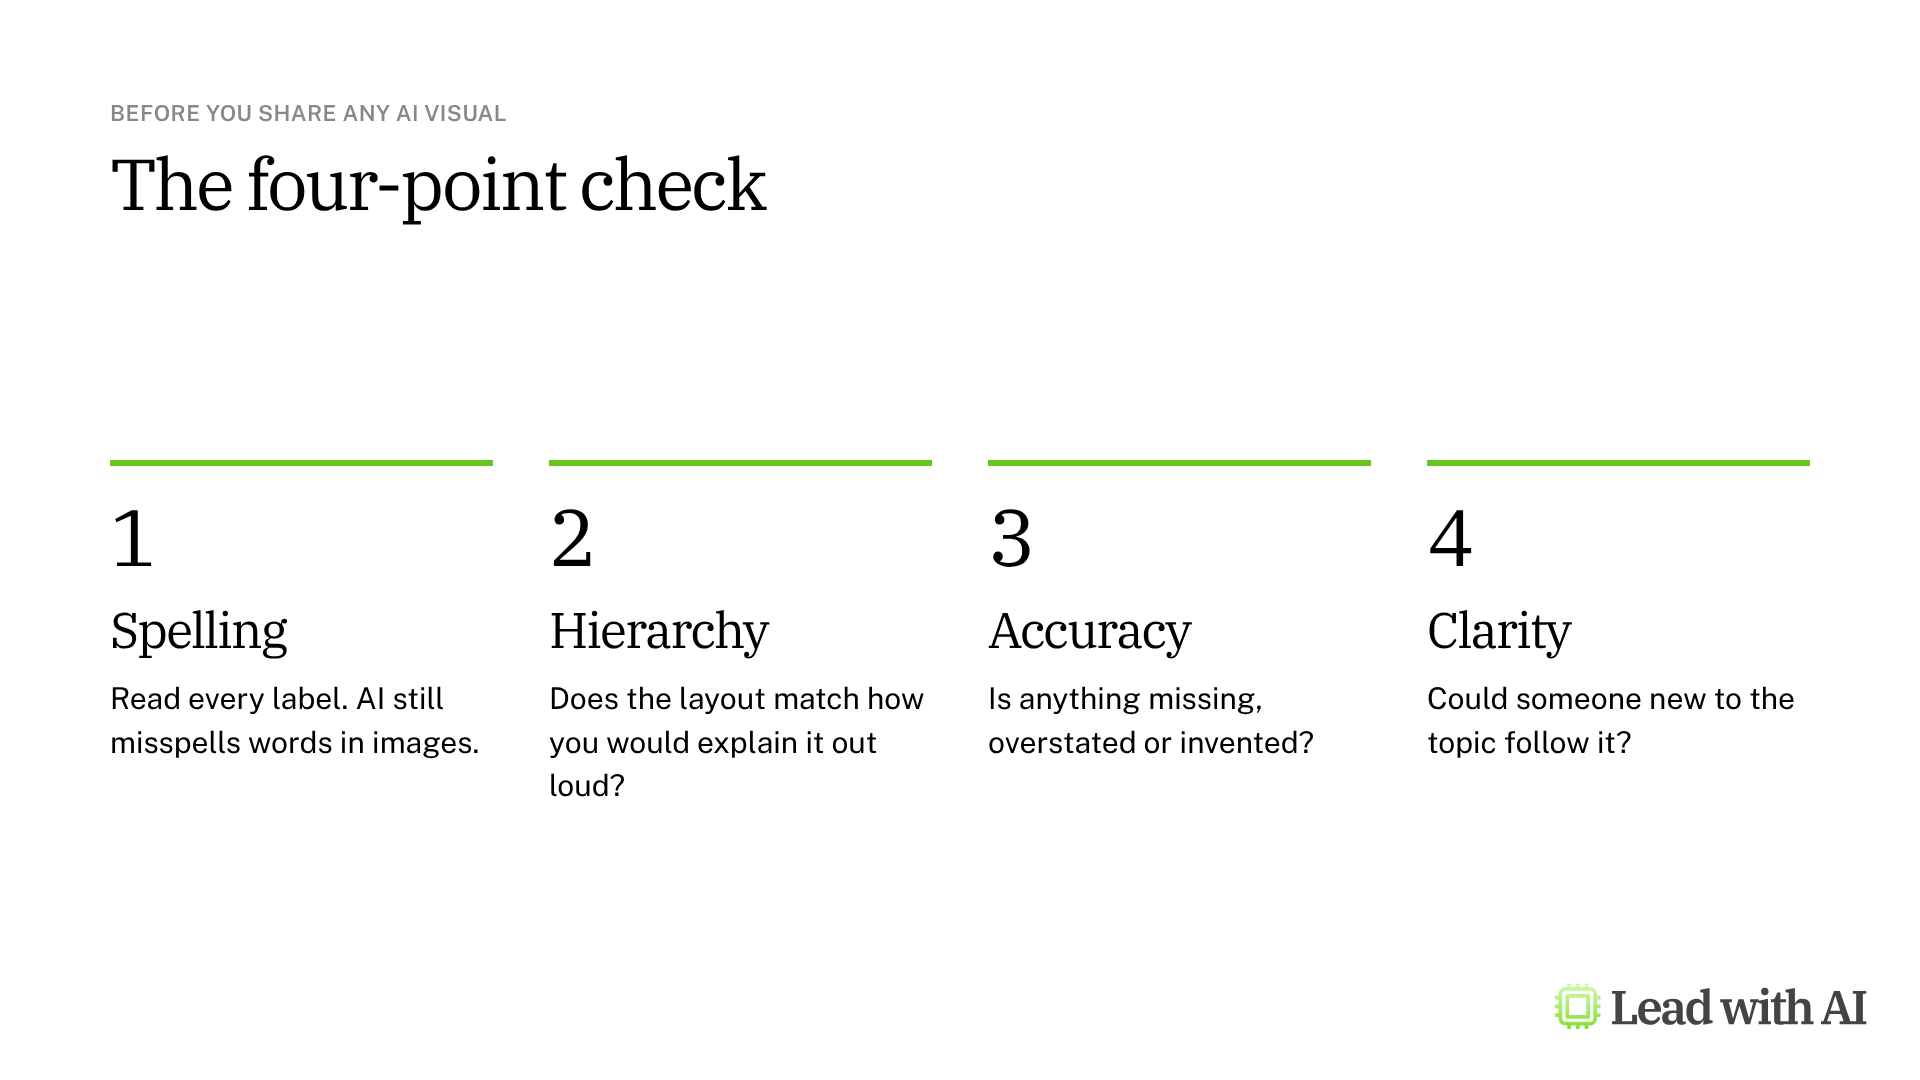
Run the four-point check before you share anything. AI visuals look finished long before they are correct, so read every label and compare the content with your source.
Use AI visuals responsibly
- Be open about AI visuals when the context calls for it, especially outside the company.
- Do not create images of real people without their agreement.
- Check logos, claims and data in every visual before you publish it.
- Keep confidential material in the tools your company has approved.
A CODO prompt to make your strategy visible
This prompt, built with our CODO framework, turns your North Star into an infographic with three to five strategic pillars. It works in all four tools. Check that the pillars reflect your real priorities, then iterate until each one is distinct.
Character: You are a visual strategist who turns leadership visions into clear, structured infographics.

Objective: I am the [role] at [company] in [industry]. My North Star is: [your North Star]. Break this into three to five strategic pillars, the core areas I need to build to get there. Then generate an infographic with my North Star at the top and the pillars beneath it, each with a one-line description of what that pillar looks like in practice for my role.

Do:
- Derive the pillars from my North Star and role, not from generic leadership models.
- Make each pillar distinct, not a synonym for another.
- Keep descriptions concrete: what I would do, not what I aspire to.

Don't:
- Don't use motivational quotes or filler words that could apply to anyone.
- Don't make a text-heavy poster.

Output:
One clean, modern infographic that is readable at a glance, with the North Star at the top and three to five pillars below, each with a short label and a one-line description.
Want to go further? Our roundup of the best AI PowerPoint generators shows how to turn these visuals into full decks.
Key takeaways
- Visualize your thinking, not just your slides.
- Brief AI like a designer: target, source, visual type and constraints.
- Start in the platform your company already uses.
- Iterate in plain language instead of starting over.
- Run the four-point check before you share.
This overview is based on the AI Visual Generation module in Lead with AI's AI Leader Advanced program. Lead with AI helps senior leaders build practical AI fluency through hands-on courses and a membership community.