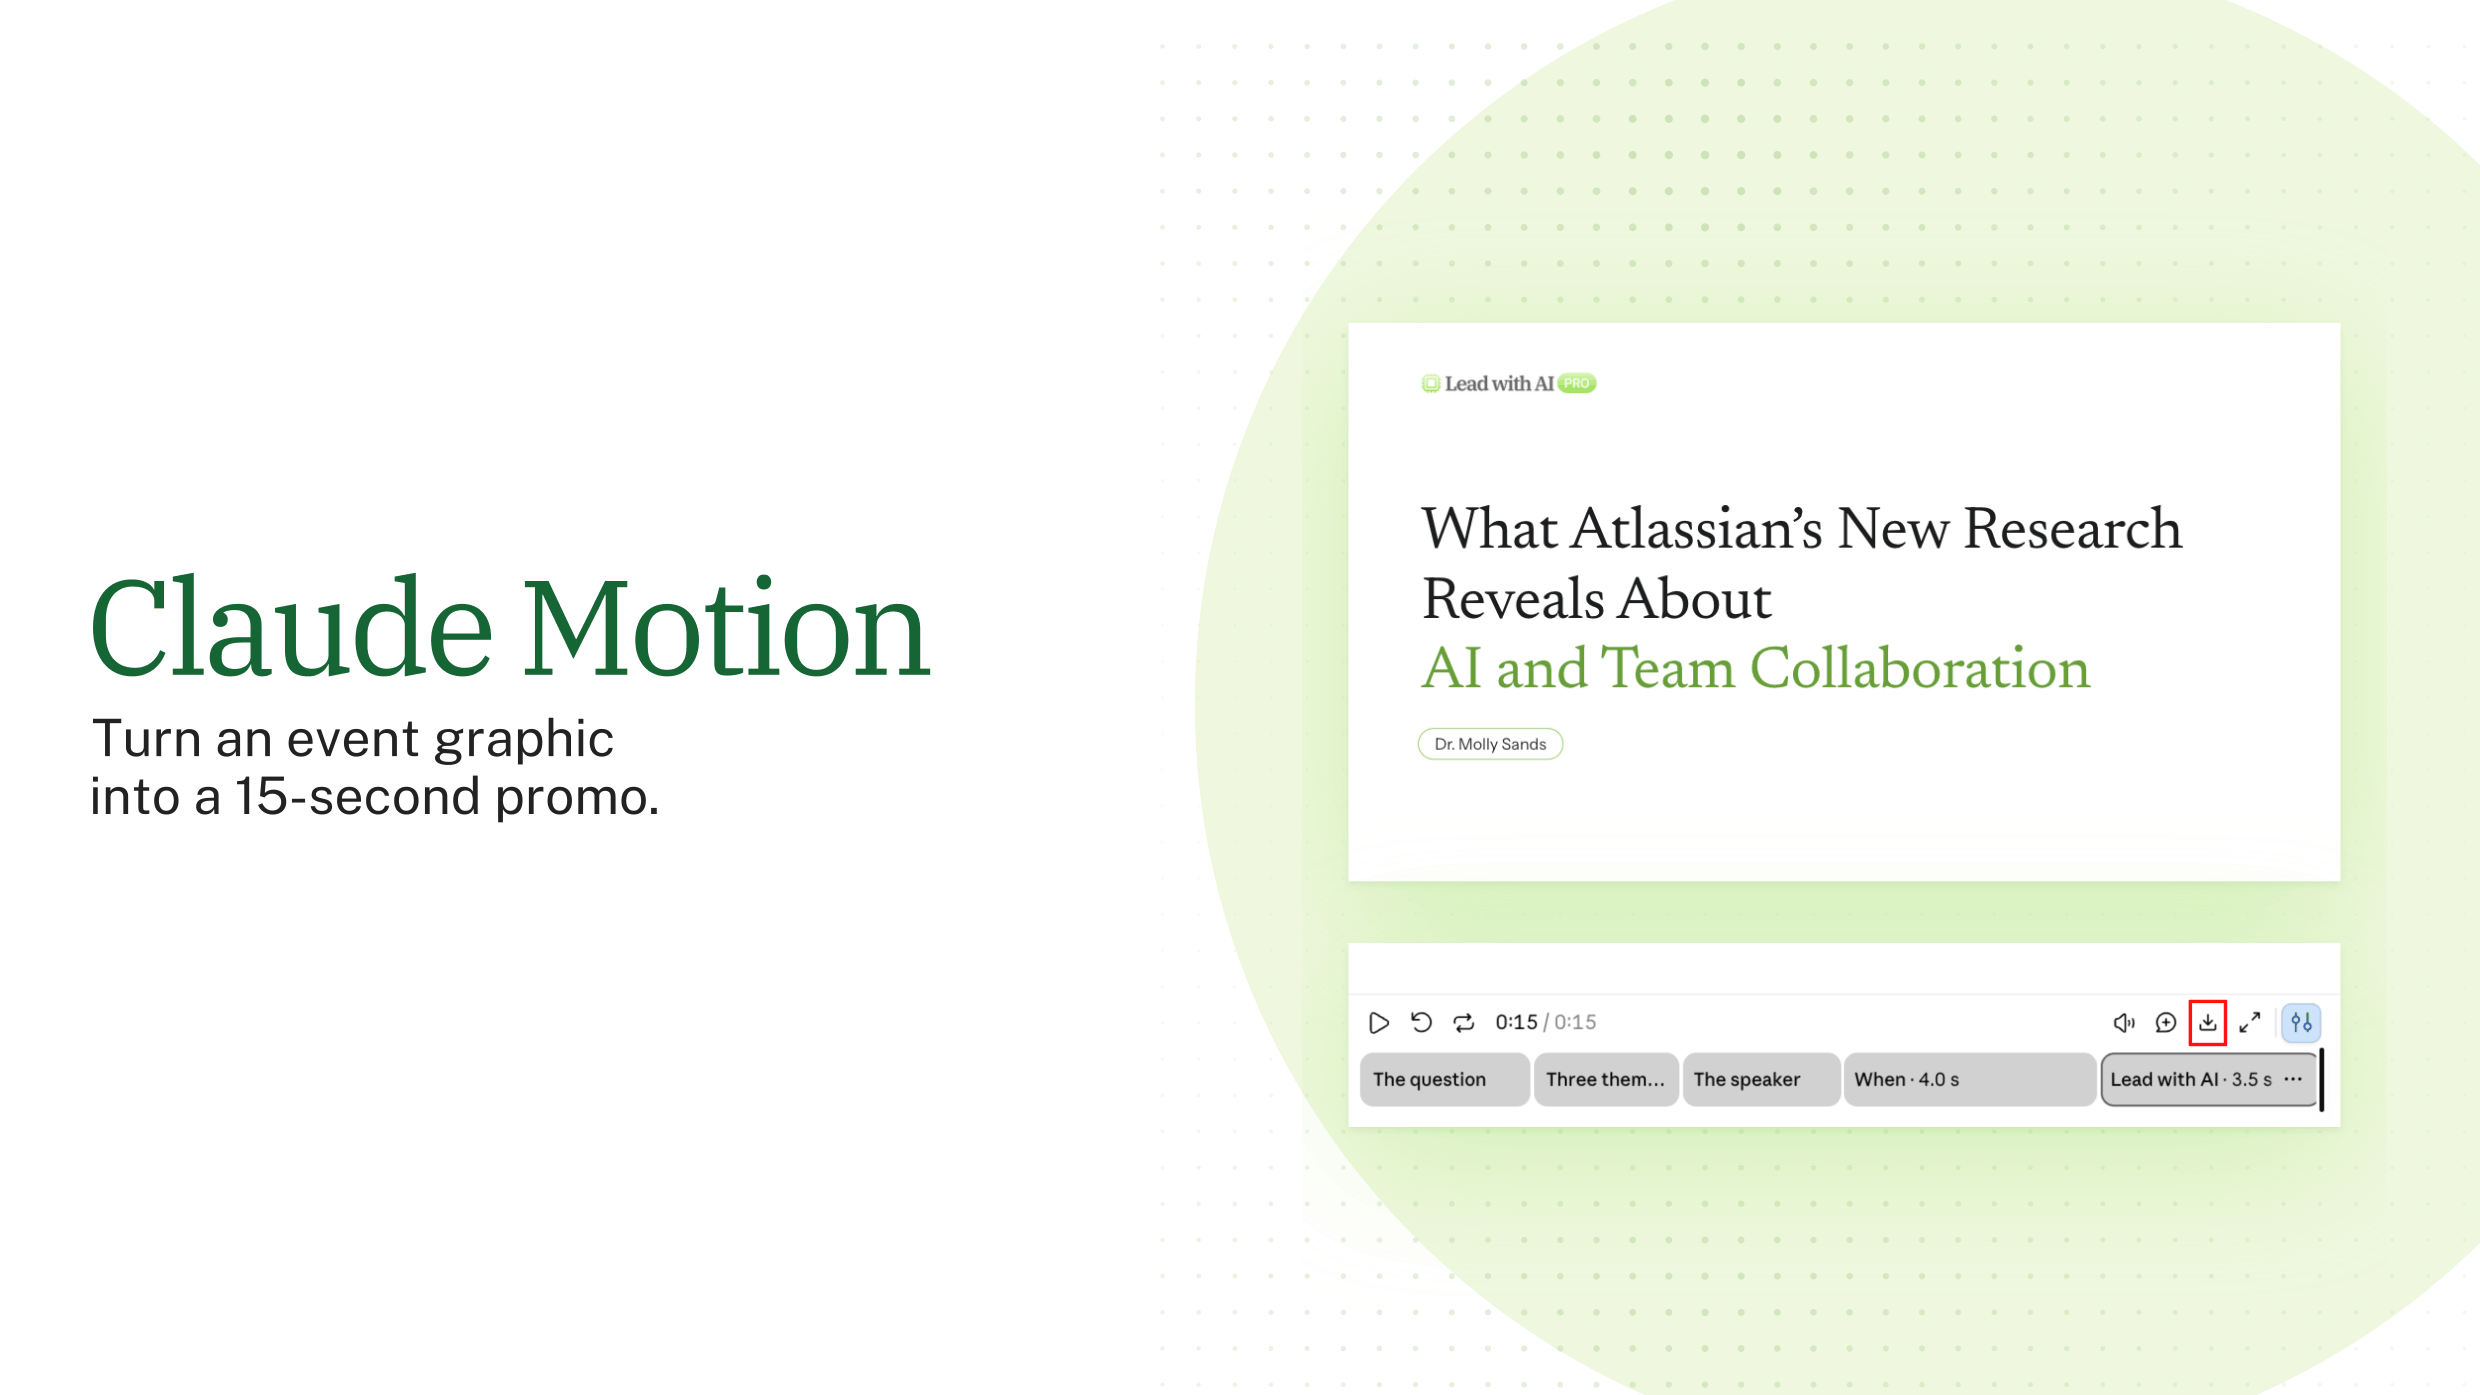

Most image tools start from a blank prompt. Gemini Notebook starts from your documents.
Gemini Notebook infographics turn the sources you upload into a one-page visual, using Google's Nano Banana image model. Gemini Notebook is Google's research tool, formerly called NotebookLM, and it was renamed in July 2026.
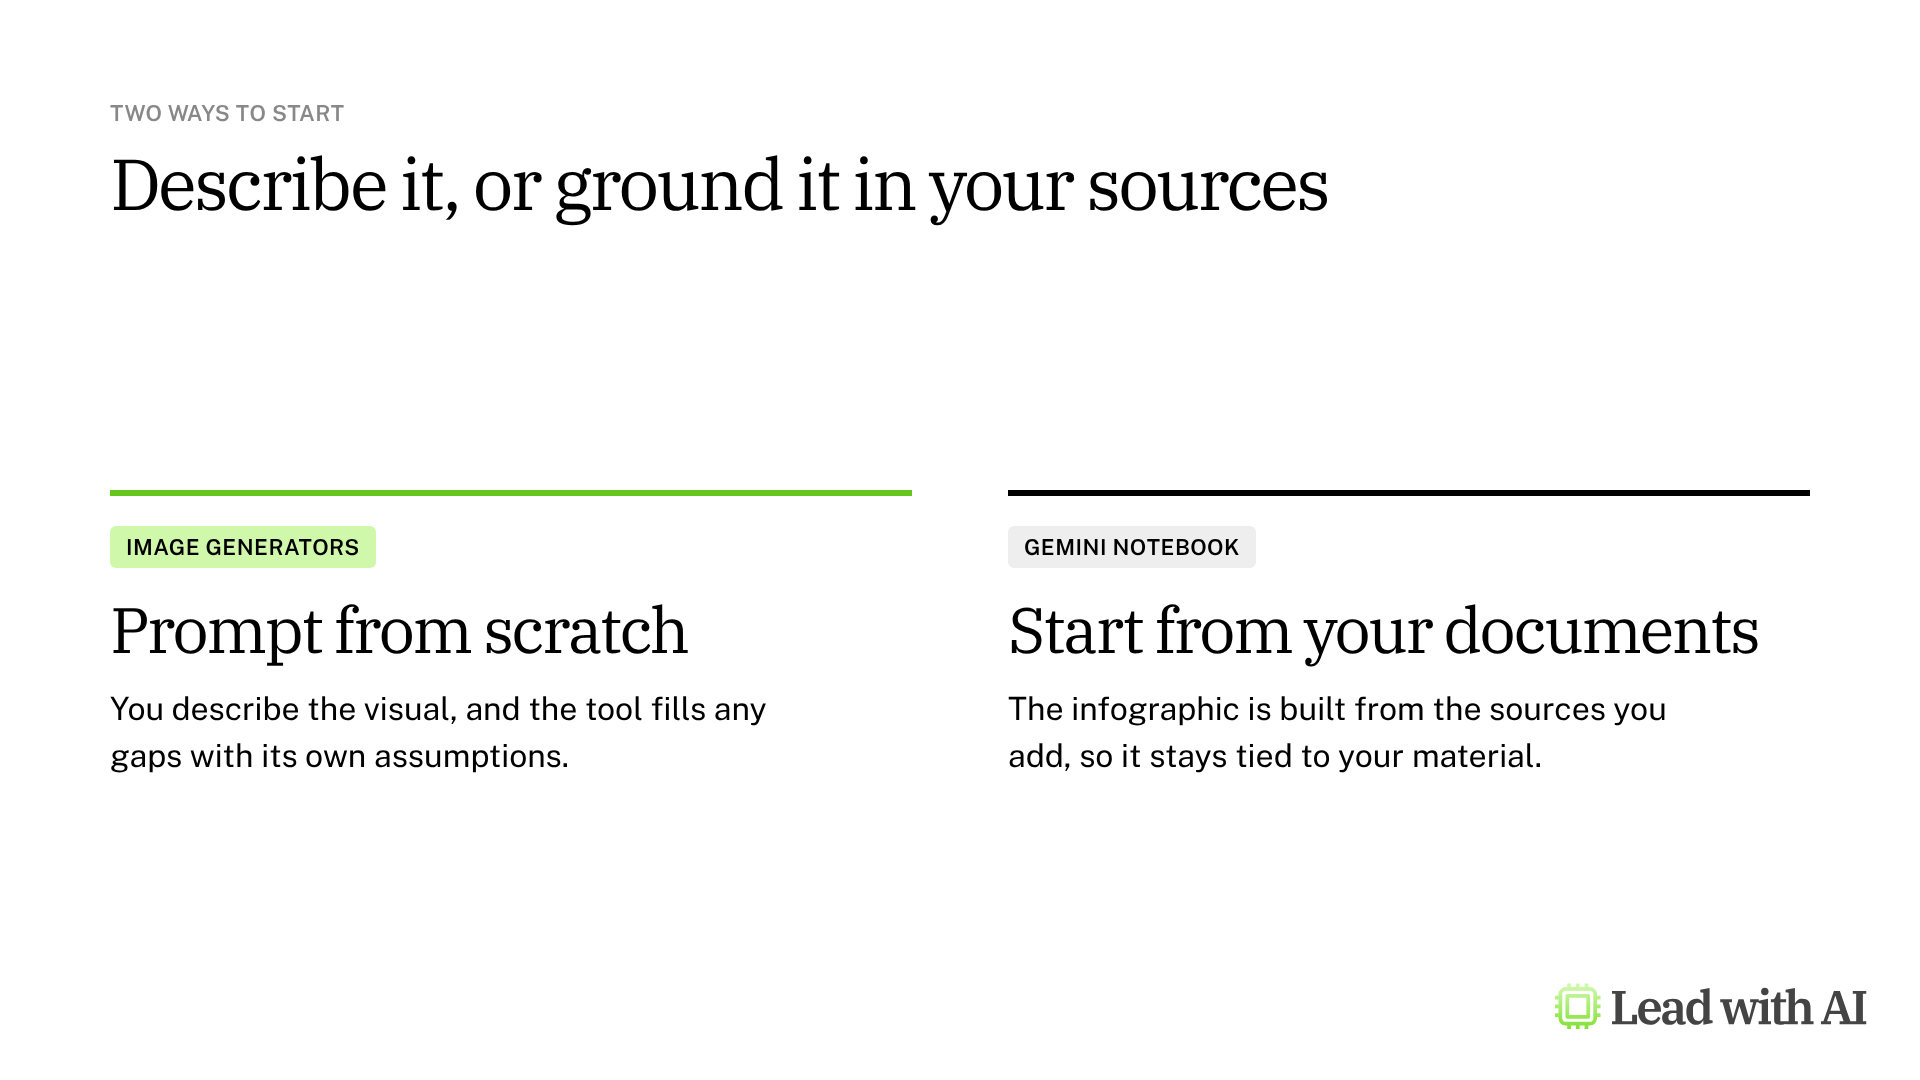
Where to find infographics in Gemini Notebook
Open Gemini Notebook, create a notebook and add your sources. Then open the Studio panel and select Infographic.
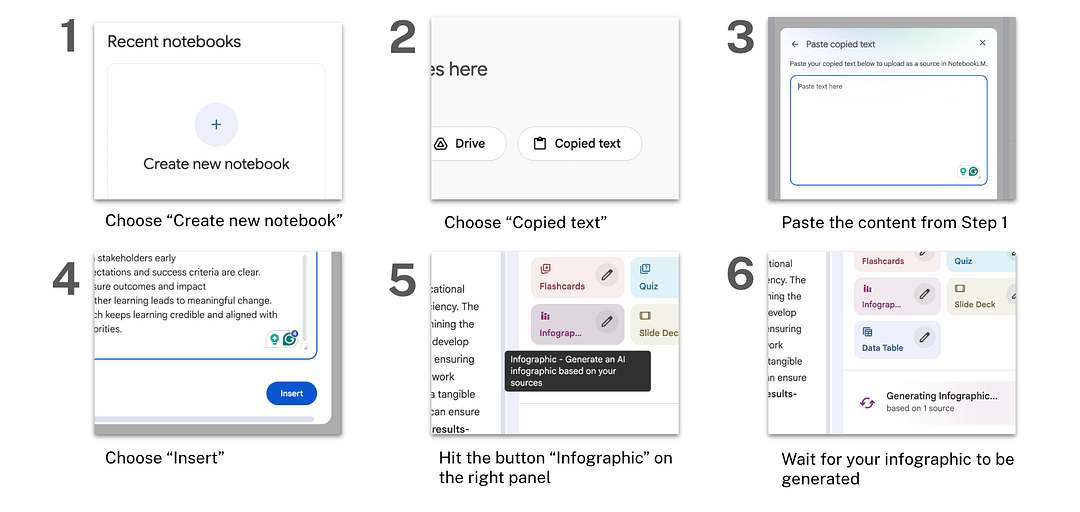
Sources can be copied text, PDFs, Google Docs, Slides and links. Paste a short piece of your own writing when you want a visual of exactly that content.
Customize before you generate
Selecting Infographic generates one straight away. Select the pencil icon instead to customize it first:
- Orientation: square, portrait or landscape. Landscape suits slides.
- Level of detail: concise, standard or detailed. Standard is usually enough for a visual someone reads in seconds.
- Visual style: choose a style, such as professional or sketch note, or let Gemini Notebook pick one.
- Language: the output language for the labels.
- Description: tell it the focus, layout and colors. With long sources, this is where you say which part to visualize.
The infographic generates in the background and can take a couple of minutes. When it is ready, open it to zoom, share or download it as a PNG.
What your plan includes
- Free accounts: anyone with a Google Account can create notebooks and infographics, within usage limits.
- Paid plans and Workspace: Google AI plans and Workspace editions raise the limits.
- Age: infographics are only available to users over 18.
- Mobile: the mobile app supports infographics, although Google notes they may differ from the web version.
When Gemini Notebook earns its place
- Visualizing a strategy document without retyping it into a prompt.
- Summarizing research from several sources in one visual.
- Making a framework you wrote look consistent with your brand.
How to create an infographic, step by step
Step 1: Add focused sources. Paste the exact text you want visualized, or upload the documents behind it.
Step 2: Customize with the pencil icon. Set the orientation and detail level, and use the description field for your brand guidelines and focus.
Step 3: Generate and review. Check the result against your sources.
Step 4: Generate again to change it. You cannot edit an infographic after it is created, so adjust the settings or description and generate a new one. To see what you asked for last time, open the three-dot menu and select View custom prompt.
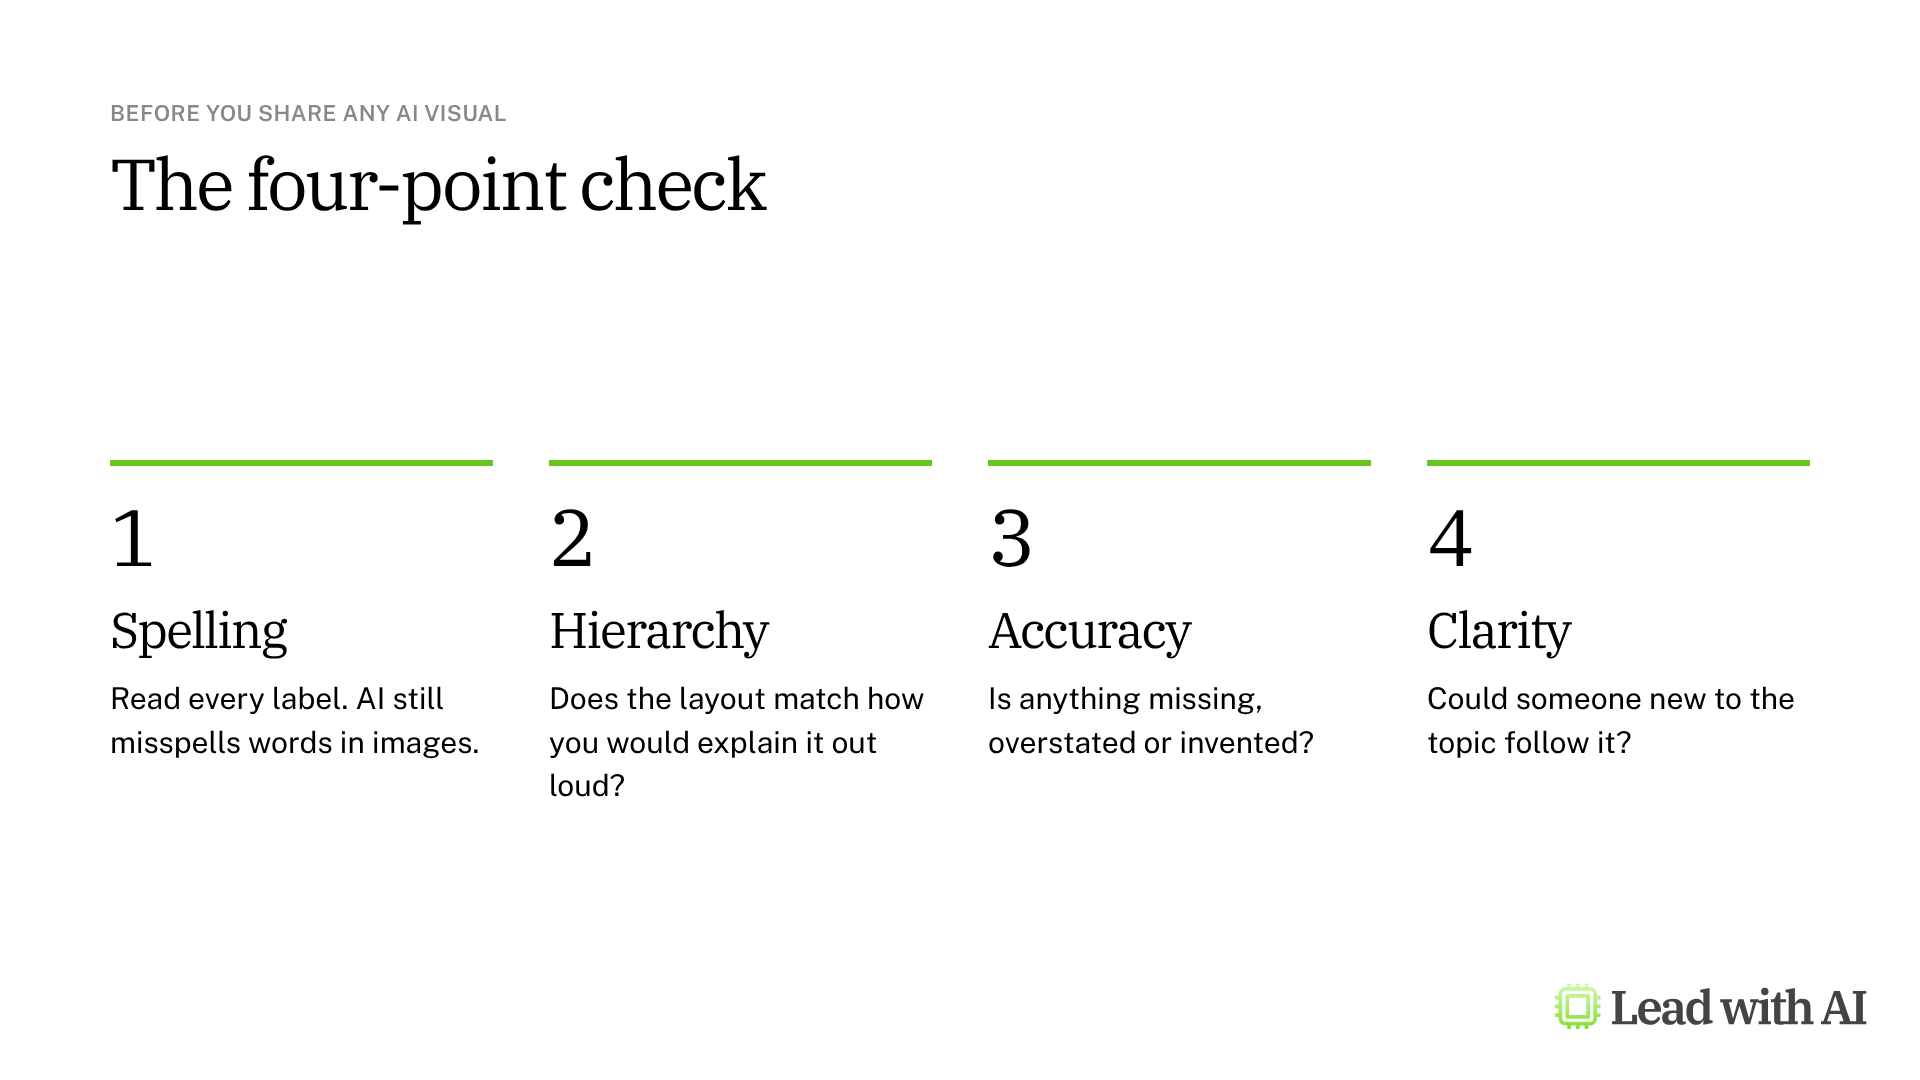
Run the four-point check before you share anything. AI visuals look finished long before they are correct, so read every label and compare the content with your source.
A CODO prompt for your first visual
This prompt focuses an infographic on the message that matters. It is built with our CODO framework. Paste it into the description field after selecting the pencil icon, and fill in the brackets.
Character: You are a visual strategist designing for senior leaders.

Objective: Turn [the document or topic] in my sources into a one-page infographic for [audience], focused on [the one message or framework to highlight].

Do:
- Show [three to five] key points, each with a short label.
- Use [your brand colors, such as black, white and green] and plenty of white space.

Don't:
- Don't include details that do not support the main message.

Output:
A clean, professional infographic that someone can understand in 15 seconds.
Want to go further? Gemini Notebook can also build slide decks from your sources and run deep research. Our article on slide decks and infographics shows both in practice.
What will your IT and legal teams ask?
- Can infographics be shared publicly? Only from personal accounts. Public sharing is turned off for Workspace Enterprise and Education accounts.
- What happens to share links? Deleting an infographic breaks any link to it.
- How accurate is it? Google warns that infographics may contain visual or factual errors, so check them before you rely on them.
- Who can create them? Anyone with edit access to the notebook.
Gemini Notebook or another tool?
Gemini Notebook is the best choice when the visual must stay true to your documents. It gives you less control over the design, and no editing after the fact.
For more design control, use Nano Banana in Gemini or ChatGPT Images. In Microsoft 365, use Copilot Create. Our overview of AI image generation compares all four options.
Key takeaways
- Start from your sources, not a blank prompt.
- Use the pencil icon to set orientation, detail and style.
- Put your brand guidelines in the description.
- Generate again to make changes.
- Run the four-point check before you share.